Between January 2022 and January 2023, connected TVs saw online audiences in the United States spend around 131 billion hours on content. Online video providers engaged users for 125 billion hours in the examined period. Overall, U.S. users spent around 121 billion hours on entertainment sites and apps, as well as 82 billion hours on e-mail and online services.
Online video and entertainment consumption in the United States from January 2022 to January 2023 (in billion hours)
Loading statistic...
Basic Account
Get to know the platform
You only have access to basic statistics.
Starter Account
The ideal entry-level account for individual users
- Instant access to 1m statistics
- Download in XLS, PDF & PNG format
- Detailed references
$199 USD / Month *
Professional Account
Full access
Business Solutions including all features.
* Prices do not include sales tax.
Other statistics that may interest you YouTube
Overview
5
- Basic Statistic Media usage in an online minute 2023
- Premium Statistic Watching less because of watching more free streaming services in the U.S. 2023
- Basic Statistic Global social networks ranked by number of users 2024
- Basic Statistic Leading websites worldwide 2023, by monthly visits
- Premium Statistic Selected social media platforms global MAU 2026
Usage and demographics
7
- Basic Statistic Countries with the most YouTube users 2024
- Basic Statistic YouTube paying subscribers 2020-2024
- Basic Statistic 
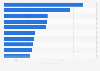
Time spent on online entertainment in the U.S. 2023
- Basic Statistic YouTube penetration in selected countries and territories 2024
- Premium Statistic YouTube: distribution of global audiences 2024, by gender
- Premium Statistic YouTube: distribution of global audiences 2024, by age and gender
- Basic Statistic U.S. teens daily YouTube video consumption 2023
Traffic
4
- Premium Statistic Countries with the highest monthly traffic volume to YouTube.com 2022
- Premium Statistic Monthly global visitor traffic to YouTube.com 2023, by device
- Premium Statistic Share of total global visitor traffic to YouTube 2023, by device
- Premium Statistic Leading global YouTube search queries 2024
YouTube on mobile
6
- Basic Statistic Leading video apps worldwide 2023, by downloads
- Basic Statistic YouTube Shorts: global logged in monthly users 2022-2023
- Premium Statistic YouTube app user engagement in selected markets 2023
- Basic Statistic YouTube IAP revenues 2024, by region
- Basic Statistic YouTube app sessions in selected countries and territories 2024
- Basic Statistic Downloads of YouTube Kids mobile app worldwide 2016-2023
Competitors
6
- Premium Statistic U.S. adults time spent per day on Netflix, TikTok, and YouTube 2020-2024
- Basic Statistic Distribution of Twitch.tv traffic 2023, by country
- Basic Statistic Downloads of Vimeo mobile app worldwide and in the U.S. 2015-2023
- Premium Statistic Quarterly Netflix subscribers count worldwide 2013-2024
- Basic Statistic Number of Hulu's paying subscribers in the U.S. 2019-2024, by quarter
- Premium Statistic Global TikTok users 2018-2029
Channels and content
8
- Basic Statistic YouTube: most viewed channels 2024
- Basic Statistic All-time most viewed YouTube channel owners 2024
- Basic Statistic YouTube: most subscribed channels 2024
- Premium Statistic YouTube: most subscribed gaming channels 2024
- Basic Statistic YouTube: most subscribed beauty content creators 2024
- Basic Statistic Most viewed YouTube videos of all time 2024
- Premium Statistic YouTube: number of interactions 2023. by audience size
- Premium Statistic Fastest viral videos based on days needed to reach 100 million views 2023
Community guidelines enforcement
8
- Basic Statistic Number of channels removed from YouTube worldwide Q3 2023
- Basic Statistic Number of videos removed from YouTube worldwide as of Q3 2023
- Basic Statistic Number of videos removed from YouTube worldwide 2023, by source of first detection
- Basic Statistic Share of videos removed from YouTube worldwide 2020-2023, by views
- Basic Statistic Share of videos removed from YouTube worldwide 2019-2023, by reason
- Basic Statistic Number of videos removed from YouTube worldwide Q3 2023, by country
- Basic Statistic Number of video comments removed from YouTube worldwide as of Q3 2023
- Basic Statistic Distribution of video comments removed from YouTube worldwide Q3 2023, by reason
Marketing & advertising
5
- Premium Statistic Global YouTube advertising revenues 2017-2023
- Basic Statistic YouTube: global advertising revenues as of Q1 2024
- Basic Statistic YouTube: share of Google revenues 2017-2023
- Premium Statistic Social media platforms used by marketers worldwide 2023
- Premium Statistic Future use of social media among marketers worldwide 2023, by platform
Further Content: You might find this interesting as well
MarTech Series. (September 6, 2023). Online video and entertainment consumption in the United States from January 2022 to January 2023 (in billion hours) [Graph]. In Statista. Retrieved June 17, 2024, from https://www.statista.com/statistics/1450767/time-spent-online-entertainment-us/
MarTech Series. "Online video and entertainment consumption in the United States from January 2022 to January 2023 (in billion hours)." Chart. September 6, 2023. Statista. Accessed June 17, 2024. https://www.statista.com/statistics/1450767/time-spent-online-entertainment-us/
MarTech Series. (2023). Online video and entertainment consumption in the United States from January 2022 to January 2023 (in billion hours). Statista. Statista Inc.. Accessed: June 17, 2024. https://www.statista.com/statistics/1450767/time-spent-online-entertainment-us/
MarTech Series. "Online Video and Entertainment Consumption in The United States from January 2022 to January 2023 (in Billion Hours)." Statista, Statista Inc., 6 Sep 2023, https://www.statista.com/statistics/1450767/time-spent-online-entertainment-us/
MarTech Series, Online video and entertainment consumption in the United States from January 2022 to January 2023 (in billion hours) Statista, https://www.statista.com/statistics/1450767/time-spent-online-entertainment-us/ (last visited June 17, 2024)
Online video and entertainment consumption in the United States from January 2022 to January 2023 (in billion hours) [Graph], MarTech Series, September 6, 2023. [Online]. Available: https://www.statista.com/statistics/1450767/time-spent-online-entertainment-us/