OPEC crude oil price stood at 100 U.S. dollars per barrel.
Saudi Arabia was the leading OPEC country in terms of global crude oil export volume in 2022. That year, the country exported some 7.4 million barrels per day. OPEC stands for the Organization of the Petroleum Exporting Countries and was established in Iraq in 1960. In 2022, the average annual Crude oil exports of OPEC countries worldwide in 2012 and 2022 (in 1,000 barrels per day)
Basic Account
Get to know the platform
You only have access to basic statistics.
This statistic is not included in your account.
Starter Account
The ideal entry-level account for individual users
- Instant access to 1m statistics
- Download in XLS, PDF & PNG format
- Detailed references
$199 USD / Month *
Professional Account
Full access
Business Solutions including all features.
* Prices do not include sales tax.
Other statistics that may interest you OPEC
Overview
6
- Premium Statistic Global oil production 1998-2022
- Premium Statistic Global oil refinery capacity 1970-2022
- Premium Statistic Global oil consumption 1970-2022
- Premium Statistic Global crude oil export value by country 2022
- Basic Statistic Voluntary oil output cuts by OPEC+ countries 2023
- Basic Statistic OPEC oil demand 2019-2045
Reserves
4
Production and refinery
6
- Premium Statistic OPEC's crude oil production 1998-2022
- Premium Statistic OPEC 's global crude oil production share 2010-2022
- Basic Statistic OPEC natural gas production by country 2012-2022
- Basic Statistic OPEC's global natural gas production share 2010-2022
- Basic Statistic OPEC refinery capacity 2010-2022
- Premium Statistic OPEC refinery capacity 2012-2022, by member state
Prices
4
Trade
5
- Basic Statistic OPEC's net oil export revenue 2021-2024
- Basic Statistic OPEC net oil export revenue streams by country 2022
- Premium Statistic 
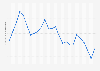
Global crude oil exports by OPEC countries 2012-2022
- Premium Statistic Oil exports from OPEC regions 2021
- Basic Statistic OPEC oil exports 2012-2022, by region
Selected member state profiles
8
- Premium Statistic Algeria's fossil fuels industry select information 2022
- Premium Statistic Angola's fossil fuels industry selected figures 2022
- Premium Statistic Equatorial Guinea's fossil fuels industry selected figures 2022
- Premium Statistic Gabon's fossil fuels industry selected figures 2022
- Premium Statistic Iran's fossil fuels industry select information 2021
- Premium Statistic Iraq's fossil fuels industry select information 2021
- Basic Statistic Kuwait's fossil fuels industry selected figures 2021
- Basic Statistic Libya's fossil fuels industry select information 2022
Further related statistics
15
- Oil exports from the U.S. 1998-2022
- Tax revenue of crude oil, gas and petroleum product exports in Russia 2011-2016
- Daily oil exports in Russia 2021-2022, by type
- Crude oil export volume in Brazil 2010-2023
- Venezuela: petroleum industry export value 2010-2018
- Daily oil exports from Russia 2010-2022
- Crude oil export volume from China 2011-2021
- Russian Druzhba pipeline: oil exports in 2018, by destination
- Value of crude oil exports Egypt 2013-2021
- Value of exports Egypt 2013-2021
- Value of exports Egypt 2021, by commodity
- Russian export duty rates on oil products 2019-2024
- Number of member countries in World Taekwondo South Korea 2017
- Global multilateral development banks' climate finance 2019
- Global World Bank's climate financing 2016-2025
Further Content: You might find this interesting as well
Statistics
- Oil exports from the U.S. 1998-2022
- Tax revenue of crude oil, gas and petroleum product exports in Russia 2011-2016
- Daily oil exports in Russia 2021-2022, by type
- Crude oil export volume in Brazil 2010-2023
- Venezuela: petroleum industry export value 2010-2018
- Daily oil exports from Russia 2010-2022
- Crude oil export volume from China 2011-2021
- Russian Druzhba pipeline: oil exports in 2018, by destination
- Value of crude oil exports Egypt 2013-2021
- Value of exports Egypt 2013-2021
- Value of exports Egypt 2021, by commodity
- Russian export duty rates on oil products 2019-2024
- Number of member countries in World Taekwondo South Korea 2017
- Global multilateral development banks' climate finance 2019
- Global World Bank's climate financing 2016-2025
Topics
OPECOPEC. (December 14, 2023). Crude oil exports of OPEC countries worldwide in 2012 and 2022 (in 1,000 barrels per day) [Graph]. In Statista. Retrieved June 16, 2024, from https://www.statista.com/statistics/264199/global-oil-exports-of-opec-countries/
OPEC. "Crude oil exports of OPEC countries worldwide in 2012 and 2022 (in 1,000 barrels per day)." Chart. December 14, 2023. Statista. Accessed June 16, 2024. https://www.statista.com/statistics/264199/global-oil-exports-of-opec-countries/
OPEC. (2023). Crude oil exports of OPEC countries worldwide in 2012 and 2022 (in 1,000 barrels per day). Statista. Statista Inc.. Accessed: June 16, 2024. https://www.statista.com/statistics/264199/global-oil-exports-of-opec-countries/
OPEC. "Crude Oil Exports of Opec Countries Worldwide in 2012 and 2022 (in 1,000 Barrels per Day)." Statista, Statista Inc., 14 Dec 2023, https://www.statista.com/statistics/264199/global-oil-exports-of-opec-countries/
OPEC, Crude oil exports of OPEC countries worldwide in 2012 and 2022 (in 1,000 barrels per day) Statista, https://www.statista.com/statistics/264199/global-oil-exports-of-opec-countries/ (last visited June 16, 2024)
Crude oil exports of OPEC countries worldwide in 2012 and 2022 (in 1,000 barrels per day) [Graph], OPEC, December 14, 2023. [Online]. Available: https://www.statista.com/statistics/264199/global-oil-exports-of-opec-countries/