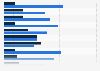
Number of beds in nursing homes per 100 elderly in China 2012-2022
The graph shows the number of nursing home beds per 100 elderly in China from 2012 to 2022. In 2022, around 2.96 beds per 100 elderly had been available.
You only have access to basic statistics.
This statistic is not included in your account.
Business Solutions including all features.
Global overview
Population figures
Healthcare burden
Elderly care
Financial situation
Further related statistics