In the first quarter of 2022, Facebook Messenger reported the largest share of daily active users in the United States among the leading streaming apps examined. The Meta-owned chat and call platform had a share of 52 percent of U.S. users engaging with the app daily, down from 58 percent in the same quarter in 2020. WhatsApp was the second most-used app, with 26 percent daily users share in the latest reported period, while daily active users on Discord experienced a modest increase between 2020 and 2021.
Market share of leading messaging and chat apps in the United States from 1st quarter 2020 to 1st quarter 2022, by daily active users
Loading statistic...
Basic Account
Get to know the platform
You only have access to basic statistics.
Starter Account
The ideal entry-level account for individual users
- Instant access to 1m statistics
- Download in XLS, PDF & PNG format
- Detailed references
$199 USD / Month *
Professional Account
Full access
Business Solutions including all features.
* Prices do not include sales tax.
Other statistics that may interest you Mobile social media usage in the United States
Overview
4
Benchmark
6
- Basic Statistic Most well-known social networks in the United States 2023
- Premium Statistic Leading social apps in the U.S. 2023, by active user reach
- Premium Statistic Awareness and download intent for selected social apps among U.S. consumers 2023
- Basic Statistic Most downloaded social media apps U.S. 2022
- Premium Statistic U.S. Gen Z leading social apps 2023
- Premium Statistic Leading social media apps used by children in the U.S. 2023
Usage
8
- Premium Statistic Leading weekly smartphone activities by U.S. users 2022, by age
- Premium Statistic Leading smartphone activities for U.S. users 2022, by gender
- Basic Statistic Monthly time spent on selected mobile social apps in the U.S. 2023
- Premium Statistic Leading social apps for users in the U.S. 2023, by weekly usage hours
- Premium Statistic Social media apps daily open rate among U.S. active users Q2 2022
- Premium Statistic U.S. iOS users initial engagement with selected social apps 2023, by generation
- Premium Statistic U.S. yearly growth in monthly time spent using social media apps on Android 2022
- Basic Statistic Weekly notifications from social apps to U.S. Gen Z mobile users 2023
Mobile messaging
6
- Premium Statistic U.S. most used messaging services and communication apps 2022, by age group
- Basic Statistic 
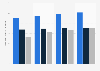
U.S. daily active user share of leading messaging and chat apps 2020-2022
- Premium Statistic U.S. adult daily mobile messaging app engagement 2018-2022
- Basic Statistic Number of U.S. Facebook Messenger users 2018-2022
- Premium Statistic WhatsApp users in the United States 2020-2029
- Basic Statistic U.S. registered WhatsApp user reach 2022, by age group
Instagram
7
- Premium Statistic Instagram brand profile in the United States 2023
- Premium Statistic Instagram, Snapchat, and TikTok: number of users in the United States 2020-2023
- Premium Statistic U.S. Instagram usage rate 2018-2023
- Premium Statistic U.S. Instagram user development 2018-2023
- Premium Statistic U.S. Instagram users 2024, by age group
- Basic Statistic U.S. Instagram users 2024, by gender
- Premium Statistic U.S. Gen Z: Instagram usage 2022, by gender
Snapchat
6
- Premium Statistic Snapchat brand profile in the United States 2024
- Premium Statistic Number of Snapchat users in the United States 2019-2026
- Premium Statistic Snapchat weekly IAP spending in the U.S. 2022
- Premium Statistic Share of Americans who used Snapchat regularly in 2022
- Basic Statistic Snapchat: distribution of U.S. audiences 2024, by gender
- Premium Statistic U.S. Gen Z: Snapchat usage 2022, by gender
TikTok
8
- Premium Statistic TikTok brand profile in the United States 2023
- Premium Statistic TikTok U.S. monthly active users 2020-2023
- Premium Statistic U.S. TikTok audience 2023, by age
- Premium Statistic U.S. TikTok audience 2023, by gender
- Premium Statistic U.S. TikTok users leading activities on the app 2023, by gender
- Premium Statistic U.S. TikTok users share of time spent on social media apps 2023
- Premium Statistic U.S. TikTok ban approval 2023
- Basic Statistic Leading TikTok keywords among U.S. Gen Z 2023
Further Content: You might find this interesting as well
Sensor Tower. (May 22, 2022). Market share of leading messaging and chat apps in the United States from 1st quarter 2020 to 1st quarter 2022, by daily active users [Graph]. In Statista. Retrieved June 01, 2024, from https://www.statista.com/statistics/1311166/us-top-messaging-apps-dau-share/
Sensor Tower. "Market share of leading messaging and chat apps in the United States from 1st quarter 2020 to 1st quarter 2022, by daily active users." Chart. May 22, 2022. Statista. Accessed June 01, 2024. https://www.statista.com/statistics/1311166/us-top-messaging-apps-dau-share/
Sensor Tower. (2022). Market share of leading messaging and chat apps in the United States from 1st quarter 2020 to 1st quarter 2022, by daily active users. Statista. Statista Inc.. Accessed: June 01, 2024. https://www.statista.com/statistics/1311166/us-top-messaging-apps-dau-share/
Sensor Tower. "Market Share of Leading Messaging and Chat Apps in The United States from 1st Quarter 2020 to 1st Quarter 2022, by Daily Active Users." Statista, Statista Inc., 22 May 2022, https://www.statista.com/statistics/1311166/us-top-messaging-apps-dau-share/
Sensor Tower, Market share of leading messaging and chat apps in the United States from 1st quarter 2020 to 1st quarter 2022, by daily active users Statista, https://www.statista.com/statistics/1311166/us-top-messaging-apps-dau-share/ (last visited June 01, 2024)
Market share of leading messaging and chat apps in the United States from 1st quarter 2020 to 1st quarter 2022, by daily active users [Graph], Sensor Tower, May 22, 2022. [Online]. Available: https://www.statista.com/statistics/1311166/us-top-messaging-apps-dau-share/