According to a survey conducted in October 2022, 78 percent of U.S. smartphone users aged 18 to 34 used their device to watch videos at least once per week. Additionally, 54 percent of smartphone users in the same age group used their devices to play games. Using the smartphone to engage with social networks at least once per week was the case for 64 percent of the respondents.
Leading smartphone activities done at least once per week among Millennial users in the United States as of October 2022
Loading statistic...
Basic Account
Get to know the platform
You only have access to basic statistics.
Starter Account
The ideal entry-level account for individual users
- Instant access to 1m statistics
- Download in XLS, PDF & PNG format
- Detailed references
$199 USD / Month *
Professional Account
Full access
Business Solutions including all features.
* Prices do not include sales tax.
Other statistics that may interest you United States internet user demographics - age groups
Internet usage overview
8
- Basic Statistic United States internet penetration 2000-2024
- Basic Statistic Internet usage penetration in the U.S. 2023, by age group and device
- Basic Statistic U.S. internet usage penetration 2023, by age group
- Basic Statistic U.S. adult internet usage reach 2000-2023, by age group
- Basic Statistic U.S. home broadband usage reach 2000-2023, by age group
- Premium Statistic U.S. internet access Q3 2023, by device
- Premium Statistic Connected devices ownership in the U.S. 2022, by age
- Basic Statistic U.S. adults who are online almost constantly 2023, by age
Mobile device and app usage
4
Online activities
7
- Premium Statistic Digital video watching frequency among U.S. adults 2022, by age group
- Premium Statistic U.S. device usage for weekly online video viewing 2022, by age group
- Premium Statistic Frequency of watching live stream video in the U.S. 2022, by age group
- Premium Statistic U.S. users who livestream their own content 2022, by age
- Premium Statistic U.S. users creating videos for the internet 2022, by age group
- Basic Statistic 
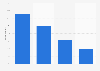
Leading weekly smartphone activities by U.S. Millennials 2022
- Premium Statistic U.S. Millennials leading activities 2022
Social media usage
8
- Basic Statistic Social media users in the United States 2020-2029
- Basic Statistic Daily minutes spent on social networks in the U.S. 2023, by age
- Basic Statistic U.S. Facebook users 2024, by age group
- Premium Statistic U.S. Instagram users 2024, by age group
- Basic Statistic U.S. registered YouTube user reach 2022, by age group
- Basic Statistic Twitter: usage reach in the United States 2023, by age group
- Premium Statistic U.S. Gen Z users monthly minutes spent on social media platforms 2022
- Basic Statistic Gen Z: selected social media platforms in the U.S. 2020-2025
User experiences and attitude
7
- Premium Statistic Attitudes towards the internet in the U.S. 2024
- Basic Statistic U.S. adults on influence of the internet on the society 2023, by age
- Basic Statistic U.S. adults understanding of digital topics 2023, by age
- Premium Statistic Frequency of digital detoxing in the U.S. 2022, by age
- Basic Statistic U.S. adults believing the internet should be a free speech zone 2022, by age group
- Premium Statistic U.S. views on free speech online and welcoming online environments 2022, by age group
- Basic Statistic Social platforms leading to empathy fatigue in the U.S. 2022, by generation
E-commerce
5
- Premium Statistic U.S. platforms used for online shopping inspiration or research 2023, by age group
- Basic Statistic Top reasons to buy products on social media in the U.S. 2023, by age group
- Premium Statistic Consumers able to identify AI on product recommendations in the U.S. 2023, by age
- Premium Statistic Locations consumers prefer purchasing groceries by age U.S. 2023
- Premium Statistic Locations consumers purchase groceries by age U.S. 2023
AI usage
5
- Basic Statistic AI knowledge of U.S. adults 2024, by age
- Basic Statistic U.S. adults trust in AI ability to provide accurate information 2024, by age
- Basic Statistic U.S. adults trust in AI ability to make ethical decisions 2024, by age
- Basic Statistic U.S. adults trust in AI ability to make unbiased decisions 2024, by age
- Basic Statistic U.S. adults on impact of AI on their lives 2024, by age
Further related statistics
19
- Most popular Android ad blockers in Norway 2018
- Most popular Android ad blockers in Finland 2018
- Daily mobile app usage in Asia Pacific 2016, by country
- Regular usage of various mobile application categories in Germany 2015
- Most popular Android ad blockers in the United Kingdom (UK) 2018
- Argentina: most used apps 2017, by age
- Most popular Android ad blockers in Denmark 2018
- Most popular Android ad blockers in Sweden 2018
- Monthly downloads of the Amazon Music app on Google Play in Germany 2019-2020
- DAU of Snapchat on android devices in Germany 2019
- MAU of the Amazon Music app on android devices in Germany 2019
- Monthly downloads of the Amazon Music app on Google Play in United Kingdom (UK) 2019
- MAU of the Amazon Music app on android devices in United Kingdom (UK) 2019
- DAU of the Amazon Music app on android devices in Austria 2019
- LINE app weekly usage in selected countries worldwide 2015
- Colombia: professional app usage 2019, by category
- U.S. adults that used apps for self-diagnosis 2017
- Brazil: weekly share of education app installs during COVID-19, by type
Further Content: You might find this interesting as well
Statistics
- Most popular Android ad blockers in Norway 2018
- Most popular Android ad blockers in Finland 2018
- Daily mobile app usage in Asia Pacific 2016, by country
- Regular usage of various mobile application categories in Germany 2015
- Most popular Android ad blockers in the United Kingdom (UK) 2018
- Argentina: most used apps 2017, by age
- Most popular Android ad blockers in Denmark 2018
- Most popular Android ad blockers in Sweden 2018
- Monthly downloads of the Amazon Music app on Google Play in Germany 2019-2020
- DAU of Snapchat on android devices in Germany 2019
- MAU of the Amazon Music app on android devices in Germany 2019
- Monthly downloads of the Amazon Music app on Google Play in United Kingdom (UK) 2019
- MAU of the Amazon Music app on android devices in United Kingdom (UK) 2019
- DAU of the Amazon Music app on android devices in Austria 2019
- LINE app weekly usage in selected countries worldwide 2015
- Colombia: professional app usage 2019, by category
- U.S. adults that used apps for self-diagnosis 2017
- Brazil: weekly share of education app installs during COVID-19, by type
Vorhaus Advisors. (November 30, 2022). Leading smartphone activities done at least once per week among Millennial users in the United States as of October 2022 [Graph]. In Statista. Retrieved June 05, 2024, from https://www.statista.com/statistics/276689/leading-smartphone-activities-us-users-by-age-group/
Vorhaus Advisors. "Leading smartphone activities done at least once per week among Millennial users in the United States as of October 2022." Chart. November 30, 2022. Statista. Accessed June 05, 2024. https://www.statista.com/statistics/276689/leading-smartphone-activities-us-users-by-age-group/
Vorhaus Advisors. (2022). Leading smartphone activities done at least once per week among Millennial users in the United States as of October 2022. Statista. Statista Inc.. Accessed: June 05, 2024. https://www.statista.com/statistics/276689/leading-smartphone-activities-us-users-by-age-group/
Vorhaus Advisors. "Leading Smartphone Activities Done at Least Once per Week among Millennial Users in The United States as of October 2022." Statista, Statista Inc., 30 Nov 2022, https://www.statista.com/statistics/276689/leading-smartphone-activities-us-users-by-age-group/
Vorhaus Advisors, Leading smartphone activities done at least once per week among Millennial users in the United States as of October 2022 Statista, https://www.statista.com/statistics/276689/leading-smartphone-activities-us-users-by-age-group/ (last visited June 05, 2024)
Leading smartphone activities done at least once per week among Millennial users in the United States as of October 2022 [Graph], Vorhaus Advisors, November 30, 2022. [Online]. Available: https://www.statista.com/statistics/276689/leading-smartphone-activities-us-users-by-age-group/