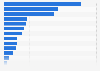
China has become one of the driving forces in the global outbound tourism industry. In 2018, the gross merchandise volume of the online outbound travel market in China grew by 21.7 percent compared to the previous year. The growth rate was estimated to remain constant at around 20 percent till 2020.
Annual growth rate of gross merchandise volume (GMV) of the online outbound travel industry in China from 2012 to 2018 with estimates until 2020
Basic Account
Get to know the platform
You only have access to basic statistics.
This statistic is not included in your account.
Starter Account
The ideal entry-level account for individual users
- Instant access to 1m statistics
- Download in XLS, PDF & PNG format
- Detailed references
$199 USD / Month *
Professional Account
Full access
Business Solutions including all features.
* Prices do not include sales tax.
Other statistics that may interest you Statistics on
About the industry
10
- Premium Statistic Online outbound tourism GMV in China 2012-2020
- Premium Statistic Leading online international travel booking websites in Taiwan 2019
- Basic Statistic Colombia: travel agencies' sales performance for Easter holidays in 2019
- Premium Statistic Tuniu's revenue 2014-2022
- Premium Statistic Tuniu's gross profit 2014-2022
- Premium Statistic Tuniu's total assets 2014-2022
- Premium Statistic Tuniu's number of employees 2014-2022
- Premium Statistic Factors influencing tourists' decision to visit Malta 2019
- Premium Statistic Most popular overseas travel products booked online in Taiwan 2019
- Premium Statistic Italy: distribution of digital tourism market value 2018, by sector
About the region
10
- Premium Statistic Number of outbound visitor departures from China 2010-2024
- Premium Statistic Most popular tourism destinations among Chinese tourists 2019
- Premium Statistic Share of Chinese tourists' outbound destinations H1 2023
- Premium Statistic Outbound tourism expenditure over GDP in China 2008-2021
- Premium Statistic Gap between inbound and outbound tourism expenditure over GDP in China 2008-2021
- Premium Statistic Number of outbound overnight visitor departures from China 2008-2020
- Premium Statistic Chinese tourists traveling in Taiwan 2018, by tour type
- Premium Statistic Commodities preferred by Chinese outbound travelers 2019
- Premium Statistic Inbound tourism expenditure over GDP in China 2008-2021
- Premium Statistic Number of cruise passenger visits at Shanghai port 2011-2020
Other regions
10
- Basic Statistic Outbound tourist flow growth in Russia 2020-2022
- Premium Statistic Inbound tourism volume in the Balearic Islands 2022, by island
- Premium Statistic Inbound tourism volume in Grenada 2010-2022
- Premium Statistic International visitor spending in Kuala Lumpur, Malaysia 2010-2018
- Premium Statistic Loss of global travel bookings from China for March and April 2020, by region
- Basic Statistic Business tourism expenditure as GDP share in Italy 1999-2019
- Premium Statistic Number of visitors to the U.S. from Brazil 2011-2022
- Premium Statistic Number of visitors to the U.S. from the UK 2011-2022
- Premium Statistic Foreign tourist arrivals breakdown in France 2020, by continent of residence
- Premium Statistic Number of foreign tourists for holiday and recreational reasons in Japan 2013-2022
Related statistics
10
- Premium Statistic Number of visitor arrivals in Hong Kong 2023, by region of origin
- Premium Statistic Number of cruise calls at Shanghai port 2011-2020
- Premium Statistic Number of inbound tourists for holiday and recreational purposes in China 2009-2019
- Premium Statistic Number of inbound tourists for business and professional purposes in China 2009-2019
- Premium Statistic Leading cities in China visited by international tourists in 2017, by arrivals
- Premium Statistic Average length of stay of visitors in Macao 2013-2023
- Premium Statistic Number of monthly visitor arrivals in Hong Kong 2020-2024
- Premium Statistic Number of visitor arrivals Macao 2013-2023
- Premium Statistic Visitor arrivals under IVS from mainland China to Macao 2023, by region
- Premium Statistic Number of short-haul arrivals in Macao 2023, by region
Further related statistics
10
- Countries with the highest number of inbound tourist arrivals worldwide 2019-2022
- Change in number of visitors from Mexico to the U.S. 2018-2024
- International tourist arrivals in Europe 2006-2023
- International tourism receipts of India 2011-2022
- Contribution of China's travel and tourism industry to GDP 2014-2023
- Middle Eastern countries with the largest international tourism receipts 2018
- Music tourist spending at concerts and festivals in the United Kingdom (UK) 2012-2016
- Passenger traffic at Dubai Airports from 2010 to 2020*
- Annual revenue of China Tourism Group Duty Free 2013-2023
- Financial advisors ranked by M&A transactions in the UK 2022, by deal value
Further Content: You might find this interesting as well
Statistics
- Countries with the highest number of inbound tourist arrivals worldwide 2019-2022
- Change in number of visitors from Mexico to the U.S. 2018-2024
- International tourist arrivals in Europe 2006-2023
- International tourism receipts of India 2011-2022
- Contribution of China's travel and tourism industry to GDP 2014-2023
- Middle Eastern countries with the largest international tourism receipts 2018
- Music tourist spending at concerts and festivals in the United Kingdom (UK) 2012-2016
- Passenger traffic at Dubai Airports from 2010 to 2020*
- Annual revenue of China Tourism Group Duty Free 2013-2023
- Financial advisors ranked by M&A transactions in the UK 2022, by deal value
iResearch. (October 9, 2019). Annual growth rate of gross merchandise volume (GMV) of the online outbound travel industry in China from 2012 to 2018 with estimates until 2020 [Graph]. In Statista. Retrieved May 04, 2024, from https://www.statista.com/statistics/1068578/china-online-outbound-travel-gmv-growth/
iResearch. "Annual growth rate of gross merchandise volume (GMV) of the online outbound travel industry in China from 2012 to 2018 with estimates until 2020." Chart. October 9, 2019. Statista. Accessed May 04, 2024. https://www.statista.com/statistics/1068578/china-online-outbound-travel-gmv-growth/
iResearch. (2019). Annual growth rate of gross merchandise volume (GMV) of the online outbound travel industry in China from 2012 to 2018 with estimates until 2020. Statista. Statista Inc.. Accessed: May 04, 2024. https://www.statista.com/statistics/1068578/china-online-outbound-travel-gmv-growth/
iResearch. "Annual Growth Rate of Gross Merchandise Volume (Gmv) of The Online Outbound Travel Industry in China from 2012 to 2018 with Estimates until 2020." Statista, Statista Inc., 9 Oct 2019, https://www.statista.com/statistics/1068578/china-online-outbound-travel-gmv-growth/
iResearch, Annual growth rate of gross merchandise volume (GMV) of the online outbound travel industry in China from 2012 to 2018 with estimates until 2020 Statista, https://www.statista.com/statistics/1068578/china-online-outbound-travel-gmv-growth/ (last visited May 04, 2024)
Annual growth rate of gross merchandise volume (GMV) of the online outbound travel industry in China from 2012 to 2018 with estimates until 2020 [Graph], iResearch, October 9, 2019. [Online]. Available: https://www.statista.com/statistics/1068578/china-online-outbound-travel-gmv-growth/