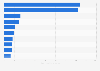
Spending on business visits from Canada to the UK between 2010 and 2016, by gender
This statistic presents travel spending on business visits from Canada to the United Kingdom (UK) between 2010 and 2016, by gender. Spending by female business visitors peaked at over 32 million British pounds in 2010, but dropped to 17 million British pounds in 2016. Spending by male visitors reached its maximum of 93.39 million British pounds in 2010. It declined sharply to 57.38 million British pounds in 2014. In 2016, it increased to 78.2 million British pounds.