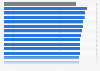
This statistic displays the share of generational groups who frequently complain about products or services in the United Kingdom (UK) in 2017. When asked if frequently complain about products or services, the generational group who agreed with this the most was the Gen Z group with 30 percent stating that they do so. The group who agreed with this the least was the Boomers group, with only 14 percent claiming that they frequently complain products or services.
Share of generational groups who frequently complain about products or services in the United Kingdom (UK) in 2017
Loading statistic...
Basic Account
Get to know the platform
You only have access to basic statistics.
Starter Account
The ideal entry-level account for individual users
- Instant access to 1m statistics
- Download in XLS, PDF & PNG format
- Detailed references
$199 USD / Month *
Professional Account
Full access
Business Solutions including all features.
* Prices do not include sales tax.
Other statistics that may interest you Statistics on
About the industry
10
- Basic Statistic Individuals who stated that they trusted the mainstream media in the UK in 2017
- Basic Statistic Individuals who love to try new things as soon as possible in the UK in 2017
- Basic Statistic Individuals who think that multitasking is an essential life skill in the UK in 2017
- Basic Statistic Individuals who believed that the BBC is a valuable institution in the UK in 2017
- Basic Statistic Individuals who believed that social media spreads extremism in the UK in 2017
- Basic Statistic Individuals who believed that the is not enough diversity on TV in the UK in 2017
- Basic Statistic Individuals who believed that social media is a good thing in the UK in 2017
- Basic Statistic Generational satisfaction with salary in the United Kingdom in 2017
- Basic Statistic Individuals who feel that the pace of innovation is increasing in the UK in 2017
- Basic Statistic Generational satisfaction with level of exercise in the United Kingdom in 2017
About the region
10
- Basic Statistic Individuals who are impulsive buyers in the UK in 2017
- Basic Statistic Individuals attitudes to technology in the UK in 2017
- Basic Statistic Individuals who favored a store to purchase goods in the UK in 2017
- Basic Statistic Individuals who turn to social media when they want to shop in the UK in 2017
- Basic Statistic Individuals who think that their mobile is an essential life tool in the UK in 2017
- Basic Statistic Individuals who think that artificial intelligence will end the world in the UK 2017
- Basic Statistic Individuals who think that the gig economy exploits workers in the UK 2017
- Basic Statistic Individuals who think that artificial intelligence will save the world in the UK 2017
- Basic Statistic Individuals who believed that fake news is a major problem in the UK in 2017
- Basic Statistic Generational perception of their success and work ethic in the United Kingdom 2017
Other regions
10
- Basic Statistic Generational priority for universal education and literacy in United Kingdom in 2017
- Premium Statistic Luxury car registrations by age cohort - United States Q3 2016 & 2018
- Premium Statistic Changes to shopping behavior if a nearby store closes down Canada 2019, by generation
- Premium Statistic Share of U.S. women who purchased secondhand clothing items in the past year, by age
- Premium Statistic Customer opinion on online advertisement in Russia in 2020, by age group
- Basic Statistic Age group distribution of French having already bought a refurbished phone 2018
- Premium Statistic Preference for environmentally aware companies in Great Britain 2014, by generation
- Premium Statistic Device usage for online shopping in Mexico 2022, by generation
- Premium Statistic Intention to take a holiday in the next twelve months by generation Australia 2019
- Premium Statistic Average Millennials expenditure on fashion in Poland 2018
Related statistics
10
- Basic Statistic Individuals who believed that religion is a good influence in the UK in 2017
- Basic Statistic Individuals who feel that the pace of innovation is decreasing in the UK in 2017
- Basic Statistic Generational satisfaction with sex life in the United Kingdom in 2017, by gender
- Basic Statistic Generational perception of their success and education in the United Kingdom 2017
- Basic Statistic Generational perception of their success and gender in the United Kingdom 2017
- Basic Statistic Individuals who believed that Brexit will be good for the UK in the UK in 2017
- Basic Statistic Generational satisfaction with work life balance in the United Kingdom in 2017
- Premium Statistic Share of respondents who feel stressed in the United Kingdom 2019 by generation
- Premium Statistic Share of respondents who keep up a good relationship with their family in the UK 2019
- Premium Statistic Share of people that buy ethically in the United Kingdom in 2019 by generation
Further related statistics
10
- Most visited city parks in the U.S. 2022
- Glencore's sales of energy products 2010-2023
- Syngenta's sales in the crop protection segment worldwide 2013-2022
- Distribution of Electrolux's sales from 2014 to 2023, by business area
- U.S. seafood industry sales in 2019, by state
- AGCO's number of employees 2006-2021
- AGCO's net income per share 2006-2022
- Revenue of the cosmetic & beauty industry in the U.S. 2002-2022
- Purchasing food or beverages online in Great Britain from 2011 to 2019
- Purchasing medicine and supplements online in Great Britain 2011-2020
Further Content: You might find this interesting as well
Statistics
- Most visited city parks in the U.S. 2022
- Glencore's sales of energy products 2010-2023
- Syngenta's sales in the crop protection segment worldwide 2013-2022
- Distribution of Electrolux's sales from 2014 to 2023, by business area
- U.S. seafood industry sales in 2019, by state
- AGCO's number of employees 2006-2021
- AGCO's net income per share 2006-2022
- Revenue of the cosmetic & beauty industry in the U.S. 2002-2022
- Purchasing food or beverages online in Great Britain from 2011 to 2019
- Purchasing medicine and supplements online in Great Britain 2011-2020
Attest. (November 6, 2017). Share of generational groups who frequently complain about products or services in the United Kingdom (UK) in 2017 [Graph]. In Statista. Retrieved May 21, 2024, from https://www.statista.com/statistics/790428/individuals-who-frequently-complain-about-products-in-uk/
Attest. "Share of generational groups who frequently complain about products or services in the United Kingdom (UK) in 2017." Chart. November 6, 2017. Statista. Accessed May 21, 2024. https://www.statista.com/statistics/790428/individuals-who-frequently-complain-about-products-in-uk/
Attest. (2017). Share of generational groups who frequently complain about products or services in the United Kingdom (UK) in 2017. Statista. Statista Inc.. Accessed: May 21, 2024. https://www.statista.com/statistics/790428/individuals-who-frequently-complain-about-products-in-uk/
Attest. "Share of Generational Groups Who Frequently Complain about Products or Services in The United Kingdom (Uk) in 2017." Statista, Statista Inc., 6 Nov 2017, https://www.statista.com/statistics/790428/individuals-who-frequently-complain-about-products-in-uk/
Attest, Share of generational groups who frequently complain about products or services in the United Kingdom (UK) in 2017 Statista, https://www.statista.com/statistics/790428/individuals-who-frequently-complain-about-products-in-uk/ (last visited May 21, 2024)
Share of generational groups who frequently complain about products or services in the United Kingdom (UK) in 2017 [Graph], Attest, November 6, 2017. [Online]. Available: https://www.statista.com/statistics/790428/individuals-who-frequently-complain-about-products-in-uk/