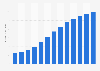
overall spend on gambling in the country reached around 2.4 billion New Zealand dollars in the same year.
Racing and sports betting expenditure in New Zealand had increased overall from fiscal year 2011 to reach 350 million New Zealand dollars in fiscal year 2018. The Expenditure on racing and sports betting in New Zealand from financial years 2011 to 2018 (in in million New Zealand dollars)
Basic Account
Get to know the platform
You only have access to basic statistics.
This statistic is not included in your account.
Starter Account
The ideal entry-level account for individual users
- Instant access to 1m statistics
- Download in XLS, PDF & PNG format
- Detailed references
$199 USD / Month *
Professional Account
Full access
Business Solutions including all features.
* Prices do not include sales tax.
Other statistics that may interest you Statistics on
About the industry
10
- Premium Statistic Gambling turnover from racing Australia FY 2019, by state
- Premium Statistic Sports betting turnover from racing Australia FY 2019, by state
- Premium Statistic Key data on the global sports betting sector 2023
- Premium Statistic Sports betting revenue in the U.S. 2018-2022
- Premium Statistic Nevada: monthly sports betting revenue 2018-2023
- Premium Statistic West Virginia: monthly sports betting revenue 2018-2023
- Premium Statistic New York: monthly sports betting revenue 2019-2023
- Premium Statistic New Hampshire: monthly sports betting handle 2020-2023
- Premium Statistic Rhode Island: monthly sports betting revenue 2018-2023
- Premium Statistic Pennsylvania: monthly sports betting revenue 2018-2023
About the region
10
- Premium Statistic Casino gambling spending New Zealand FY 2011-2018
- Premium Statistic Lottery spending New Zealand FY 2011-2018
- Premium Statistic Gaming machine spending New Zealand FY 2011-2018
- Premium Statistic Gambling spending New Zealand FY 2018 by activity
- Premium Statistic Gambling spending New Zealand FY 2011-2018
- Premium Statistic Number of gambling machines New Zealand 2009-2018
- Premium Statistic Gambling activities industry employees New Zealand 2018 by region
- Premium Statistic Gaming machine numbers in New Zealand 2009-2019
- Premium Statistic Share of weekly grocery spend New Zealand 2019 by expenditure range
- Premium Statistic Yearly retail spending per person in New Zealand 2018, by type
Selected statistics
1
Other regions
10
- Premium Statistic Share of French men and women who bet on a sport game at least once in 2019
- Basic Statistic Casino visitors in the U.S. ordered by age group 2010
- Premium Statistic Share of gross online casino revenue in Denmark 2022, by game
- Premium Statistic Germany: sales breakdown of gambling providers 2009-2017
- Premium Statistic Gambling revenue in Canada by gaming segment 2016-2017
- Premium Statistic Casino visits in Switzerland from 2010 to 2017
- Premium Statistic Casino gaming: revenue in the Asia-Pacific region 2015
- Basic Statistic Number of gambling establishments in the UK 2008-2012
- Basic Statistic Lottery-related activities among men in England in 2012, by age
- Premium Statistic Revenue of casino gaming in Finland from 2009 to 2015
Related statistics
10
- Premium Statistic Number of venues with gaming machines in Australia as of June 30, 2020
- Premium Statistic Casinos in Australia as of June 30, 2020, by state and territory
- Premium Statistic Total gaming turnover Australia FY 2020, by type
- Premium Statistic Total gambling turnover Australia FY 2020, by state
- Premium Statistic Total gaming turnover New South Wales in Australia FY 2020, by type
- Premium Statistic Total gaming turnover Australia FY 2020, by state
- Premium Statistic Number of gaming machines operating in Australia 2011-2020
- Premium Statistic Government revenue from gambling in Australia FY2010-2020
- Premium Statistic Per capita gambling expenditure in Australia FY2010-2020
- Premium Statistic Total gambling turnover Australia FY 2020, by type
Further related statistics
7
- Gross gambling yield of the gambling industry in Great Britain 2015-2022, by sector
- Casino gaming revenue in Atlantic City 2015
- Casino gaming: revenue in Russia 2015
- Total assets of MGM Resorts International worldwide 2008-2022
- Bingo revenue in Great Britain 2009-2022, by type
- Ethical personal products: spending in the United Kingdom (UK) 2011-2021
- How American employees plan to spend their year-end bonus 2011
Further Content: You might find this interesting as well
Statistics
- Gross gambling yield of the gambling industry in Great Britain 2015-2022, by sector
- Casino gaming revenue in Atlantic City 2015
- Casino gaming: revenue in Russia 2015
- Total assets of MGM Resorts International worldwide 2008-2022
- Bingo revenue in Great Britain 2009-2022, by type
- Ethical personal products: spending in the United Kingdom (UK) 2011-2021
- How American employees plan to spend their year-end bonus 2011
Department of Internal Affairs (New Zealand). (July 29, 2019). Expenditure on racing and sports betting in New Zealand from financial years 2011 to 2018 (in in million New Zealand dollars) [Graph]. In Statista. Retrieved May 03, 2024, from https://www.statista.com/statistics/1032741/new-zealand-racing-and-sports-betting-expenditure/
Department of Internal Affairs (New Zealand). "Expenditure on racing and sports betting in New Zealand from financial years 2011 to 2018 (in in million New Zealand dollars)." Chart. July 29, 2019. Statista. Accessed May 03, 2024. https://www.statista.com/statistics/1032741/new-zealand-racing-and-sports-betting-expenditure/
Department of Internal Affairs (New Zealand). (2019). Expenditure on racing and sports betting in New Zealand from financial years 2011 to 2018 (in in million New Zealand dollars). Statista. Statista Inc.. Accessed: May 03, 2024. https://www.statista.com/statistics/1032741/new-zealand-racing-and-sports-betting-expenditure/
Department of Internal Affairs (New Zealand). "Expenditure on Racing and Sports Betting in New Zealand from Financial Years 2011 to 2018 (in in Million New Zealand Dollars)." Statista, Statista Inc., 29 Jul 2019, https://www.statista.com/statistics/1032741/new-zealand-racing-and-sports-betting-expenditure/
Department of Internal Affairs (New Zealand), Expenditure on racing and sports betting in New Zealand from financial years 2011 to 2018 (in in million New Zealand dollars) Statista, https://www.statista.com/statistics/1032741/new-zealand-racing-and-sports-betting-expenditure/ (last visited May 03, 2024)
Expenditure on racing and sports betting in New Zealand from financial years 2011 to 2018 (in in million New Zealand dollars) [Graph], Department of Internal Affairs (New Zealand), July 29, 2019. [Online]. Available: https://www.statista.com/statistics/1032741/new-zealand-racing-and-sports-betting-expenditure/