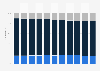
According to a survey about Generation Z in China, about 62.8 percent of respondents born between the mid-to-late 1990s and early 2010s had a monthly disposable income between 1,000 and 3,000 yuan. Respondents also indicated that they spent nearly 20 percent of their consumption on dining out.
Distribution of monthly disposable income among Generation Z in China as of 2020
Basic Account
Get to know the platform
You only have access to basic statistics.
This statistic is not included in your account.
Starter Account
The ideal entry-level account for individual users
- Instant access to 1m statistics
- Download in XLS, PDF & PNG format
- Detailed references
$199 USD / Month *
Professional Account
Full access
Business Solutions including all features.
* Prices do not include sales tax.
Other statistics that may interest you Statistics on
About the industry
10
- Premium Statistic Factors effecting consumption of Generation Z in China 2020
- Premium Statistic Distribution of private household consumer spending in Germany 1970-2023, by segment
- Premium Statistic Consumer spending distribution of urban and rural households in China 2023, by use
- Basic Statistic Private consumption expenditure on housing in Finland 2007-2017
- Premium Statistic Food and beverages sales distribution in Sweden 2017, by segment
- Premium Statistic Paraguay: private consumption expenditure 2015-2018
- Premium Statistic Mexico: private consumption expenditure 2015-2018
- Premium Statistic Uruguay: private consumption expenditure 2006-2017
- Basic Statistic Household consumption expenditure in France 1990-2016
- Basic Statistic Consumer food at home expenditure share in selected countries 2013
About the region
10
- Premium Statistic Retail sales of consumer goods in China by month 2022-2024
- Premium Statistic Year-on-year change in trade revenue of consumer goods China by month 2022-2024
- Premium Statistic Per capita spending of urban households in China on food 1990-2023
- Premium Statistic Per capita spending of urban households in China on clothes, shoes 1990-2023
- Premium Statistic Per capita spending of urban households in China on household goods 1990-2023
- Premium Statistic Per capita spending of urban households in China on education & leisure 1990-2023
- Premium Statistic Per capita consumption in urban and rural China 2023, by use
- Premium Statistic Ratio of per capita income of urban and rural households in Shanxi, China 2010-2022
- Premium Statistic Share of general public budget expenditure for education in Shanxi, China 2010-2022
- Premium Statistic Public expenditure share for social security and employment Shanxi, China 2010-2022
Other regions
10
- Premium Statistic Per capita consumption of skim milk in Norway 1979-2023
- Premium Statistic Preferred breakfast sandwich breads among Canadians 2019
- Basic Statistic At-home expenditure on pasta in Spain 2021, by type
- Premium Statistic Free sugar and calorie intake from at-home food and drink Great Britain 2015
- Premium Statistic Latin America: per capita spending on cereal 2016
- Premium Statistic Per capita consumption of meat in Sweden 1990-2017, by type
- Premium Statistic Ways French people enjoy eating foie gras in 2019
- Premium Statistic Increases in non-edible grocery purchases due to COVID-19 outbreak by type U.S. 2020
- Basic Statistic UK: increases in edible grocery purchases due to COVID-19 outbreak in 2020, by type
- Premium Statistic Increases in CPG demand due to COVID-19 outbreak worldwide September 2020, by country
Related statistics
10
- Premium Statistic Public expenditure share for healthcare and family planning Shanxi, China 2010-2022
- Premium Statistic Per capita expenditure of private households in China on education 2022, by region
- Premium Statistic Business outlook under the impact of COVID-19 in China 2020, by selected market
- Premium Statistic Personal consumption expenditure per capita of Hong Kong 2010-2020
- Premium Statistic Single malt Scotch whisky selling price Hong Kong with forecast 2011-2020
- Premium Statistic Wage increases over price increases among professionals in China 2011
- Premium Statistic Consumer confidence in China 2019-2024
- Premium Statistic Average spending of residents in Shenzhen 2022, China, by category
- Premium Statistic Migrant workers' sense of belonging in urban China 2022
- Basic Statistic GDP growth in China 2022, by region
Further related statistics
10
- Consumer expenditure on live entertainment in the U.S. 1999-2013
- Consumer expenditure on photo studios in the U.S. 1999-2013
- Coal consumption in South Africa 1998-2022
- Import volume of cobalt in the U.S. 2010-2023
- Primary energy consumption in Brazil 2009-2022
- Primary energy consumption in Germany 1998-2022
- Primary energy consumption in Asia Pacific 2022
- Primary energy consumption change in China 2000-2022
- Global primary energy consumption 2022, by country
- Primary energy consumption in South Korea 2021-2022, by fuel
Further Content: You might find this interesting as well
Statistics
- Consumer expenditure on live entertainment in the U.S. 1999-2013
- Consumer expenditure on photo studios in the U.S. 1999-2013
- Coal consumption in South Africa 1998-2022
- Import volume of cobalt in the U.S. 2010-2023
- Primary energy consumption in Brazil 2009-2022
- Primary energy consumption in Germany 1998-2022
- Primary energy consumption in Asia Pacific 2022
- Primary energy consumption change in China 2000-2022
- Global primary energy consumption 2022, by country
- Primary energy consumption in South Korea 2021-2022, by fuel
KuRunData. (January 14, 2021). Distribution of monthly disposable income among Generation Z in China as of 2020 [Graph]. In Statista. Retrieved May 11, 2024, from https://www.statista.com/statistics/1212574/china-distribution-of-disposable-income-among-generation-z/
KuRunData. "Distribution of monthly disposable income among Generation Z in China as of 2020." Chart. January 14, 2021. Statista. Accessed May 11, 2024. https://www.statista.com/statistics/1212574/china-distribution-of-disposable-income-among-generation-z/
KuRunData. (2021). Distribution of monthly disposable income among Generation Z in China as of 2020. Statista. Statista Inc.. Accessed: May 11, 2024. https://www.statista.com/statistics/1212574/china-distribution-of-disposable-income-among-generation-z/
KuRunData. "Distribution of Monthly Disposable Income among Generation Z in China as of 2020." Statista, Statista Inc., 14 Jan 2021, https://www.statista.com/statistics/1212574/china-distribution-of-disposable-income-among-generation-z/
KuRunData, Distribution of monthly disposable income among Generation Z in China as of 2020 Statista, https://www.statista.com/statistics/1212574/china-distribution-of-disposable-income-among-generation-z/ (last visited May 11, 2024)
Distribution of monthly disposable income among Generation Z in China as of 2020 [Graph], KuRunData, January 14, 2021. [Online]. Available: https://www.statista.com/statistics/1212574/china-distribution-of-disposable-income-among-generation-z/