
Federica Laricchia
Research expert covering the global consumer technology industry

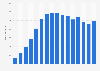
Revenue of the consumer electronics industry worldwide 2019-2029
Revenue of the consumer electronics market worldwide from 2019 to 2029 (in billion U.S. dollars)

Consumer electronics market revenue worldwide 2023, by segment
Revenue of the global consumer electronics market in 2023, by segment (in billion U.S. dollars)

IT devices total spending worldwide 2012-2024
Global spending on devices (PCs, tablets, mobile phones, and printers) from 2012 to 2024 (in billion U.S. dollars)

Smartphone revenues worldwide 2011-2023
Smartphone revenues worldwide from 2011 to 2023 (in billion U.S. dollars)
Global smartphone unit shipments 2009-2023
Global smartphone shipments from 2009 to 2023 (in million units)

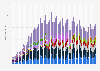
Global smartphone shipments by quarter 2009-2024
Smartphone shipments worldwide from 4th quarter 2009 to 2nd quarter 2024 (in million units)

Smartphone unit shipments worldwide 2007-2023, by vendor
Global smartphone shipments from 2007 to 2023, by vendor (in million units)
Global smartphone shipments by vendor 2009-2024
Smartphone shipments by vendor worldwide from 4th quarter 2009 to 2nd quarter 2024 (in million units)

Global market share of smartphone vendors 2014-2022
Global smartphone shipments market share by leading vendors from 2014 to 2022

Quarterly smartphone market share worldwide by vendor 2009-2024
Global smartphone market share from 4th quarter 2009 to 2nd quarter 2024, by vendor

Global smartphone production volume share 2023, by brand
Manufacturers/brands' share of smartphone production volume (units) worldwide from 2015 to 2023

Market share of mobile operating systems worldwide 2009-2024, by quarter
Market share of mobile operating systems worldwide from 2009 to 2024, by quarter

Smartphone market share of the Android operating system 2009-2023
Android OS market share of smartphone sales to end users from 2009 to 2023

Mobile Android version market share worldwide 2018-2024
Mobile Android operating system market share worldwide from January 2018 to February 2024, by version
Mobile Apple iOS version market share worldwide 2011-2024
Mobile Apple iOS market share by version worldwide 2011 to 2024, by quarter

iOS version share of Apple devices worldwide 2016-2024
Share of Apple devices by iOS version worldwide from 2016 to 2024*

Number of global mobile subscriptions 1993-2023
Number of mobile (cellular) subscriptions worldwide from 1993 to 2023 (in millions)

Smartphone penetration worldwide as share of global population 2016-2023
Global smartphone penetration rate as share of population from 2016 to 2023

Global smartphone adoption rate 2021-2030, by region
Smartphone adoption rate worldwide in selected years from 2021 to 2030, by region

Smartphone mobile network subscriptions worldwide 2016-2028
Number of smartphone mobile network subscriptions worldwide from 2016 to 2023, with forecasts from 2023 to 2028 (in millions)

Monthly data traffic per smartphone worldwide 2016-2028
Mobile data traffic per smartphone worldwide from 2016 to 2028 (in GB/month)

Share of mobile internet traffic in selected regions 2024
Mobile internet traffic as percentage of total web traffic in selected countries and regions in January 2024

Smartphone traffic worldwide per month 2012-2028
Average monthly smartphone traffic worldwide from 2012 to 2028 (in exabytes)

Most popular smartphone activities for global users 2023
Leading smartphone users activities worldwide in 2023

Countries with the highest number of cities in which 5G is available 2023
Number of cities in which 5G is available 2023 by country

5G mobile subscriptions worldwide 2019-2029, by region
Forecast number of 5G mobile subscriptions worldwide from 2019 to 2029, by region (in millions)

Global 5G smartphone shipments 2020-2027
Volume of 5G smartphone shipments worldwide from 2020 to 2027 (in millions)

Global 5G smartphone penetration rate 2020-2027
Penetration rate of 5G smartphones worldwide from 2020 to 2027

Average 5G download speed in leading countries 2023
Average 5G download speed in leading nations in 2023 (download speed in Mbps)


Mon - Fri, 9am - 6pm (EST)
Mon - Fri, 9am - 5pm (SGT)
Mon - Fri, 10:00am - 6:00pm (JST)
Mon - Fri, 9:30am - 5pm (GMT)
Mon - Fri, 9am - 6pm (EST)


