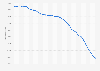
This graph shows the change in levels of confidence that survey respondents in the United States had for the specified public institutions and organizations from 2011 to 2012. In 2012, 41 percent of U.S. respondents had either a great deal or quite a lot of confidence in the medical system in the U.S. as compared to 39 percent in 2011.
Change in confidence levels in various public institutions in American society from 2011 to 2012
Loading statistic...
Basic Account
Get to know the platform
You only have access to basic statistics.
Starter Account
The ideal entry-level account for individual users
- Instant access to 1m statistics
- Download in XLS, PDF & PNG format
- Detailed references
$199 USD / Month *
Professional Account
Full access
Business Solutions including all features.
* Prices do not include sales tax.
Other statistics that may interest you Statistics on
About the industry
10
- Basic Statistic U.S. confidence in business, public institutions and other organizations 2022
- Basic Statistic American's confidence in public institutions, by political affiliation 2012
- Premium Statistic Joint Address to Congress - number of viewers 1993-2017
- Basic Statistic Confidence level among the American people in Donald Trump's political abilties
- Basic Statistic Trust among U.S. Millennials of major institutions in 2016
- Basic Statistic Americans on the government shutdown in 2013
- Basic Statistic Public concern about crime prevention in the United Kingdom (UK) 2007-2012
- Basic Statistic U.S. public opinion on if income taxes are too high 2000-2023
- Basic Statistic U.S. adults on military power 2023
- Basic Statistic Sources of information about Italian politics in Italy 2022
About the region
10
- Premium Statistic Readers of The Washington Post in the U.S. 2023, by age
- Premium Statistic U.S. budget of nuclear weapons stockpile FY 2021-2027, by funding component
- Premium Statistic U.S. change in Congressional seats of president's party midterm elections 1934-2022
- Premium Statistic U.S. newspaper publishers revenue 2010-2021, by source
- Premium Statistic U.S. publishing industry - estimated revenue 2005-2021
- Basic Statistic Job approval ratings of U.S. presidents at midterm elections 1946-2022
- Basic Statistic Leading daily newspapers in the U.S. 2023, by print circulation
- Basic Statistic Unemployment rate in U.S. publishing industries 2001-2022
- Premium Statistic U.S. nuclear weapons budget request FY 2019-2027
- Basic Statistic U.S. confidence in political parties to protect from external threats 2005-2023
Other regions
10
- Premium Statistic Daily media time spent on printed newspapers in Sweden 2009-2022
- Premium Statistic Newspaper publishing revenue in China 2008-2018
- Premium Statistic Circulation of newspapers in Brazil 2007-2021
- Premium Statistic Leading print media companies in Colombia 2020-2021, by revenue
- Premium Statistic Global newspaper ad spend growth 2000-2024
- Premium Statistic Penetration of daily media usage in the EU 2011-2023, by media
- Premium Statistic Share of printed newspaper readers in Norway 2009-2021, by type of newspaper
- Premium Statistic Daily average newspaper circulation in Singapore 2012-2021
- Premium Statistic Newspaper revenue in Mexico 2013-2027, by source
- Premium Statistic Printed newspaper readership in Australia 2021
Related statistics
10
- Basic Statistic U.S. House of Representatives - Voting rates for representatives 1908-2018
- Premium Statistic U.S. House of Representatives - Number of votes cast for representatives 1908-2018
- Premium Statistic U.S. nuclear weapons Surveillance Program budget 2015-2020
- Premium Statistic Number of government shutdowns in the U.S. by sitting president 1976-2019
- Premium Statistic U.S. public opinion on airstrikes in Syria as of 2017, by political ideology
- Basic Statistic Election 2012: final results for the House or Representatives
- Premium Statistic U.S. Air Force total aircraft fleet FY 2020-2023 by type
- Basic Statistic U.S. share of registered voters 2022, by age
- Basic Statistic U.S. share of registered voters 2022, by gender
- Basic Statistic U.S. voting rate in presidential elections 1996-2020, by race or ethnicity
Further related statistics
6
- Digital news purchases worldwide 2023
- Children's magazines ranked by sales volume in the United Kingdom (UK) 2018-2019
- Distribution of monthly magazine sales in the United Kingdom (UK) 2019, by sector
- Share of teachers in the U.S. 2012, by ethnicity and school type
- Terrorism - deaths grouped by victim category 2011
- Share of teachers in the U.S. 2007/08, by base salary and school type
Further Content: You might find this interesting as well
Statistics
- Digital news purchases worldwide 2023
- Children's magazines ranked by sales volume in the United Kingdom (UK) 2018-2019
- Distribution of monthly magazine sales in the United Kingdom (UK) 2019, by sector
- Share of teachers in the U.S. 2012, by ethnicity and school type
- Terrorism - deaths grouped by victim category 2011
- Share of teachers in the U.S. 2007/08, by base salary and school type
Gallup. (June 20, 2012). Change in confidence levels in various public institutions in American society from 2011 to 2012 [Graph]. In Statista. Retrieved May 06, 2024, from https://www.statista.com/statistics/234060/change-in-confidence-levels-in-us-public-institutions/
Gallup. "Change in confidence levels in various public institutions in American society from 2011 to 2012." Chart. June 20, 2012. Statista. Accessed May 06, 2024. https://www.statista.com/statistics/234060/change-in-confidence-levels-in-us-public-institutions/
Gallup. (2012). Change in confidence levels in various public institutions in American society from 2011 to 2012. Statista. Statista Inc.. Accessed: May 06, 2024. https://www.statista.com/statistics/234060/change-in-confidence-levels-in-us-public-institutions/
Gallup. "Change in Confidence Levels in Various Public Institutions in American Society from 2011 to 2012." Statista, Statista Inc., 20 Jun 2012, https://www.statista.com/statistics/234060/change-in-confidence-levels-in-us-public-institutions/
Gallup, Change in confidence levels in various public institutions in American society from 2011 to 2012 Statista, https://www.statista.com/statistics/234060/change-in-confidence-levels-in-us-public-institutions/ (last visited May 06, 2024)
Change in confidence levels in various public institutions in American society from 2011 to 2012 [Graph], Gallup, June 20, 2012. [Online]. Available: https://www.statista.com/statistics/234060/change-in-confidence-levels-in-us-public-institutions/