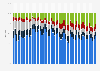
In 2010, there were two reported smelters or refiners in Apple's supply chain (out of a total of 109 smelters or refiners) that were either participating in or verified through a third-party audit to guarantee that they were not using tantalum, tin, tungsten, or gold (also know as 3TG) from regions where these materials are produced in conditions of armed conflict or human rights abuses. By 2015, all of the smelters and refiners in Apple's supply chain were verified to not be using conflict minerals.
Number of conflict mineral-free verified smelters and refiners in Apple's supply chain from 2009 to 2015*
Basic Account
Get to know the platform
You only have access to basic statistics.
This statistic is not included in your account.
Starter Account
The ideal entry-level account for individual users
- Instant access to 1m statistics
- Download in XLS, PDF & PNG format
- Detailed references
$199 USD / Month *
Professional Account
Full access
Business Solutions including all features.
* Prices do not include sales tax.
Other statistics that may interest you Statistics on
About the industry
10
- Premium Statistic Mined lead production United Kingdom (UK) 2009-2017
- Basic Statistic Copper consumption in the U.S. 2010-2023
- Premium Statistic Leading South African mining companies based on market capitalization 2023
- Premium Statistic Distribution of expenses in the mining industry in South Africa 2023, by type
- Premium Statistic Distribution of platinum production worldwide by producer 2022
- Premium Statistic PPI for metal ores Thailand 2009-2022
- Premium Statistic Mining industry enterprises New Zealand 2023, by type
- Premium Statistic Production of elemental sulfur in Egypt 2015-2019
- Premium Statistic Production of phosphoric acid in Egypt 2011-2019
- Premium Statistic Bentonite production in Egypt 2011-2019
About the region
10
- Premium Statistic Global oil refinery capacity 2010 & 2022, by country
- Basic Statistic Shell's refinery throughput and feedstock intake 2010-2023
- Basic Statistic Shell: refinery capacity 2010-2023
- Premium Statistic Global production of refined secondary copper 2005-2022
- Premium Statistic Global oil refinery throughput 1990 & 2022, by country
- Basic Statistic Global cobalt refinery production 2011-2021
- Basic Statistic Gazprom's refined products revenue worldwide 2016-2021
- Basic Statistic Distribution of global refined zinc production by country 2019
- Basic Statistic Fall in global petroleum refining volumes due to Covid-19 2020
- Premium Statistic Global number of active mineral exploration sites 2017, by region and type
Selected statistics
7
- Basic Statistic Mine lifespan by selected commodities
- Premium Statistic Global barite mine production 2023, by country
- Premium Statistic Number of Rio Tinto's employees 2010-2023
- Basic Statistic Rio Tinto's net income 2005-2023
- Premium Statistic Freeport-McMoRan's revenue 2010-2023
- Basic Statistic Freeport-McMoRan's net income 2010-2023
- Premium Statistic Development of global gold stocks 2000-2015
Other regions
10
- Basic Statistic Conflict minerals usage ranking of electronics companies U.S. 2017
- Premium Statistic Refined lead production United Kingdom (UK) 2009-2021
- Premium Statistic Oil refinery throughput in Algeria 2010-2022
- Premium Statistic Share of gold production in Canada 2022, by region
- Premium Statistic Oil refinery capacity in African countries 2022
- Premium Statistic Mineral revenue in South Africa by commodity 2023
- Premium Statistic Petroleum refinery capacity in the UAE 2009-2019
- Premium Statistic Production volume of naphtha in Indonesia 2007-2018
- Premium Statistic Italy: leading suppliers of marble and similar stones 2016-2018, by import value
- Premium Statistic Primary steel & iron industry production value in Colombia 2014-2020
Related statistics
10
- Premium Statistic Conflict minerals usage ranking of selected U.S. jewelry retailers 2017
- Premium Statistic Gold reserves in Canada 1980-2019
- Premium Statistic Number of active mineral exploration sites worldwide by region 2017
- Premium Statistic Distribution of active mineral exploration sites worldwide by region 2017
- Basic Statistic Canada's leading minerals by production value 2015
- Premium Statistic Canada's global ranking of selected mineral commodity production 2022
- Premium Statistic Share of palladium production worldwide 2022, by mining company
- Premium Statistic Distribution of nickel production worldwide 2022, by producer
- Premium Statistic Distribution of copper production worldwide 2022, by company
- Premium Statistic Distribution of global rough diamond production on a carat basis 2022, by country
Further related statistics
10
- Global graphite reserves 2023, by country
- U.S. value of automotive parts sourced from U.S. located suppliers 2000-2010
- Agnico-Eagle Mines' gold reserves 2000-2022
- Devon Energy revenue 2007-2023
- Leading cement producing countries worldwide 2023
- Comparison of cobalt consumption in the U.S. 2010-2023
- Murphy Oil: net income 2007-2020
- Devon Energy's total assets 2007-2020
- Eni S.p.A.'s refinery throughputs 2009-2019
- Concho Resources' revenue 2007-2019
Further Content: You might find this interesting as well
Statistics
- Global graphite reserves 2023, by country
- U.S. value of automotive parts sourced from U.S. located suppliers 2000-2010
- Agnico-Eagle Mines' gold reserves 2000-2022
- Devon Energy revenue 2007-2023
- Leading cement producing countries worldwide 2023
- Comparison of cobalt consumption in the U.S. 2010-2023
- Murphy Oil: net income 2007-2020
- Devon Energy's total assets 2007-2020
- Eni S.p.A.'s refinery throughputs 2009-2019
- Concho Resources' revenue 2007-2019
gamesindustry.biz. (June 9, 2016). Number of conflict mineral-free verified smelters and refiners in Apple's supply chain from 2009 to 2015* [Graph]. In Statista. Retrieved April 29, 2024, from https://www.statista.com/statistics/662349/conflict-mineral-free-verified-smelters-and-refiners-in-apples-supply-chain/
gamesindustry.biz. "Number of conflict mineral-free verified smelters and refiners in Apple's supply chain from 2009 to 2015*." Chart. June 9, 2016. Statista. Accessed April 29, 2024. https://www.statista.com/statistics/662349/conflict-mineral-free-verified-smelters-and-refiners-in-apples-supply-chain/
gamesindustry.biz. (2016). Number of conflict mineral-free verified smelters and refiners in Apple's supply chain from 2009 to 2015*. Statista. Statista Inc.. Accessed: April 29, 2024. https://www.statista.com/statistics/662349/conflict-mineral-free-verified-smelters-and-refiners-in-apples-supply-chain/
gamesindustry.biz. "Number of Conflict Mineral-free Verified Smelters and Refiners in Apple's Supply Chain from 2009 to 2015*." Statista, Statista Inc., 9 Jun 2016, https://www.statista.com/statistics/662349/conflict-mineral-free-verified-smelters-and-refiners-in-apples-supply-chain/
gamesindustry.biz, Number of conflict mineral-free verified smelters and refiners in Apple's supply chain from 2009 to 2015* Statista, https://www.statista.com/statistics/662349/conflict-mineral-free-verified-smelters-and-refiners-in-apples-supply-chain/ (last visited April 29, 2024)
Number of conflict mineral-free verified smelters and refiners in Apple's supply chain from 2009 to 2015* [Graph], gamesindustry.biz, June 9, 2016. [Online]. Available: https://www.statista.com/statistics/662349/conflict-mineral-free-verified-smelters-and-refiners-in-apples-supply-chain/