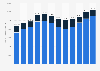
This statistic displays the operating profits and losses generated by McLaren Automotive from 2013 to 2018. McLaren Automotive sustained their greatest operating profit in 2018, at 67.1 million British pounds.
Annual operating profit/loss of McLaren Automotive from 2013 to 2018 (in million GBP)
Basic Account
Get to know the platform
You only have access to basic statistics.
This statistic is not included in your account.
Starter Account
The ideal entry-level account for individual users
- Instant access to 1m statistics
- Download in XLS, PDF & PNG format
- Detailed references
$199 USD / Month *
Professional Account
Full access
Business Solutions including all features.
* Prices do not include sales tax.
Other statistics that may interest you Statistics on
About the industry
10
- Premium Statistic McLaren Automotive: new road car investments 2013-2018
- Premium Statistic McLaren Automotive: net profit/loss 2012-2018
- Premium Statistic McLaren Automotive: net assets 2012-2018
- Premium Statistic McLaren Automotive: number of employees 2012-2018
- Premium Statistic McLaren Automotive: number of employees 2017-2018, by sector
- Premium Statistic McLaren Automotive: annual turnover 2012-2018
- Premium Statistic McLaren Automotive: expenditure on research and development (R&D) for 2012-2016
- Premium Statistic McLaren Automotive: number of cars delivered in 2016, by class
- Premium Statistic Passenger car production in Japan 2014-2023
- Premium Statistic Volume of passenger vehicle production Thailand 2019-2023
About the region
10
- Basic Statistic UK: enterprises in the manufacture of motor vehicles & trailers 2009-2018
- Basic Statistic United Kingdom: enterprises in the manufacture of motor vehicles 2009-2018
- Premium Statistic Automotive industry supply chain added value in the United Kingdom (UK) 2017-2022
- Premium Statistic Commercial vehicle sales: United Kingdom 2019 & 2022
- Premium Statistic UK: motor vehicle sales 2005-2022
- Basic Statistic New car registrations in the United Kingdom (UK) 2022, by brand
- Premium Statistic Jaguar car sales in the United Kingdom (UK) 2019-2020
- Premium Statistic Jaguar Land Rover: global sales, by region 2015-2019
- Premium Statistic Car dealers: profit as percentage of sales in the United Kingdom (UK) 2012-2020
- Premium Statistic Car dealers: sales per salesperson in the United Kingdom (UK) 2012-2020
Other regions
10
- Premium Statistic Gross profit of Guangzhou Automobile Group (GAC) 2012-2019
- Basic Statistic Italy: enterprises in the manufacture of motor vehicles & trailers 2013-2022
- Basic Statistic Romania: enterprises in the manufacture of motor vehicles & trailers 2013-2022
- Basic Statistic North Macedonia: enterprises in the manufacture of motor vehicles & trailers 2022
- Basic Statistic Bosnia: number of enterprises in the manufacture of motor vehicles & trailers 2022
- Basic Statistic Enterprises in the manufacture of motor vehicles & trailers in Finland 2013-2022
- Basic Statistic Slovakia: enterprises in the manufacture of motor vehicles 2013-2022
- Basic Statistic Croatia: enterprises in the manufacture of motor vehicles & trailers 2013-2022
- Premium Statistic European vehicle manufacturing countries: production by vehicle type 2022
- Basic Statistic Latvia: enterprises in the manufacture of motor vehicles 2013-2022
Related statistics
10
- Premium Statistic SAIC Motor: gross profit 2010-2021
- Premium Statistic Gross profit of Beijing Automotive Industry Holding (BAIC) 2011-2021
- Premium Statistic Guangzhou Automobile Group (GAC): revenue 2012-2021
- Premium Statistic Number of employees at Guangzhou Automobile Group (GAC) 2019
- Premium Statistic Total assets of Guangzhou Automobile Group (GAC) 2012-2019
- Premium Statistic Production capacity of Guangzhou Automobile Group (GAC) 2012-2019, by category
- Premium Statistic Bentley: yearly car sales in Europe 2000-2019
- Premium Statistic ADAS technology sensors for LVs market volume in China 2013-2033
- Premium Statistic LV adaptive cruise control system sensor market volume in China 2013-2033
- Basic Statistic Share of automobile sales in China in 2010 and 2025, by segment
Further related statistics
8
- China: SAIC auto sales by type 2009-2021
- Danone: recurring operating margin by geographical region, 2016-2023
- Global revenue share of EssilorLuxottica in 2022, by geographical area
- The adidas Group's EBITDA worldwide 2000-2023
- Hugo Boss - EBITDA 2005-2023
- Air Liquide's dividend per share 2005-2023
- Net income of Dine Brands Global worldwide 2008-2023
- Rio Tinto's net income 2005-2023
Further Content: You might find this interesting as well
Statistics
- China: SAIC auto sales by type 2009-2021
- Danone: recurring operating margin by geographical region, 2016-2023
- Global revenue share of EssilorLuxottica in 2022, by geographical area
- The adidas Group's EBITDA worldwide 2000-2023
- Hugo Boss - EBITDA 2005-2023
- Air Liquide's dividend per share 2005-2023
- Net income of Dine Brands Global worldwide 2008-2023
- Rio Tinto's net income 2005-2023
Companies House. (May 24, 2019). Annual operating profit/loss of McLaren Automotive from 2013 to 2018 (in million GBP) [Graph]. In Statista. Retrieved April 29, 2024, from https://www.statista.com/statistics/699654/mclaren-automotive-operating-profit/
Companies House. "Annual operating profit/loss of McLaren Automotive from 2013 to 2018 (in million GBP)." Chart. May 24, 2019. Statista. Accessed April 29, 2024. https://www.statista.com/statistics/699654/mclaren-automotive-operating-profit/
Companies House. (2019). Annual operating profit/loss of McLaren Automotive from 2013 to 2018 (in million GBP). Statista. Statista Inc.. Accessed: April 29, 2024. https://www.statista.com/statistics/699654/mclaren-automotive-operating-profit/
Companies House. "Annual Operating Profit/Loss of Mclaren Automotive from 2013 to 2018 (in Million Gbp)." Statista, Statista Inc., 24 May 2019, https://www.statista.com/statistics/699654/mclaren-automotive-operating-profit/
Companies House, Annual operating profit/loss of McLaren Automotive from 2013 to 2018 (in million GBP) Statista, https://www.statista.com/statistics/699654/mclaren-automotive-operating-profit/ (last visited April 29, 2024)
Annual operating profit/loss of McLaren Automotive from 2013 to 2018 (in million GBP) [Graph], Companies House, May 24, 2019. [Online]. Available: https://www.statista.com/statistics/699654/mclaren-automotive-operating-profit/