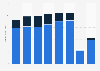
The statistic shows the time of produced television animations in Japan from 2005 to 2015. In 2015, the production time reached about 116 thousand minutes, equivalent to about 1,930 hours. During the measured time period, the longest production time was recorded in 2006 with about 136 thousand minutes.
Television production of animations in Japan from 2005 to 2015 (in 1,000 minutes)
Basic Account
Get to know the platform
You only have access to basic statistics.
This statistic is not included in your account.
Starter Account
The ideal entry-level account for individual users
- Instant access to 1m statistics
- Download in XLS, PDF & PNG format
- Detailed references
$199 USD / Month *
Professional Account
Full access
Business Solutions including all features.
* Prices do not include sales tax.
Other statistics that may interest you Statistics on
About the industry
10
- Premium Statistic Newly broadcast TV anime programs Japan 2013-2022
- Premium Statistic Continuously broadcast TV animation programs Japan 2013-2022
- Premium Statistic Production minutes of daytime and late-night TV anime Japan 2013-2022
- Premium Statistic TV anime broadcasting market size Japan 2013-2022
- Premium Statistic TV watching time per day in Spain 1997-2023
- Premium Statistic Average daily TV viewing time in Sweden 2014-2023, by age
- Premium Statistic Average daily TV viewing time in Sweden 2009-2023, by gender
- Premium Statistic Average daily TV viewing time in Sweden 2010-2023
- Premium Statistic Length of television programs produced in China 2022, by type of program
- Premium Statistic Value of imported TV programs to China 2022, by world region
About the region
10
- Premium Statistic Box office revenue of anime movies Japan 2013-2022
- Premium Statistic Number of theatrical anime movies Japan 2013-2022
- Premium Statistic Anime videogram market size Japan 2013-2022
- Premium Statistic Domestic revenue of the anime industry Japan 2013-2022
- Premium Statistic Production minutes of theatrical anime movies Japan 2013-2022
- Premium Statistic Overseas revenue of the anime industry Japan 2013-2022
- Premium Statistic Toho's number of employees FY 2014-2023
- Premium Statistic Shochiku's net sales FY 2013-2022
- Premium Statistic Animation consumer spending in Japan 1980-2017
- Premium Statistic Children with disabilities participating in sports in Japan 2022, by frequency
Selected statistics
3
Other regions
10
- Basic Statistic Top-grossing video game movies worldwide as of 2024
- Premium Statistic Distribution of Norwegian Broadcasting Corporation’s TV air time 2021, by genre
- Basic Statistic Production value of the information & communication industry in Germany 2012-2021
- Premium Statistic Daily television viewing time in Vietnam 2015-2018
- Basic Statistic Share of adults watching the Golden Globes in the U.S. 2020, by ethnicity
- Premium Statistic Monthly consumption of linear TV and VOD in the Netherlands 2018-2021
- Premium Statistic Typology of products and services providers hired by Mediaset España 2021
- Premium Statistic Employment in the film and television industry India FY 2019, by sector
- Premium Statistic Channel digital channels share of total TV viewing 2010-2021, by channel
- Premium Statistic Daily TV viewing time in Finland 2012-2022
Related statistics
10
- Premium Statistic Revenue of the anime industry Japan 2022, by segment
- Premium Statistic Anime merchandising market size Japan 2013-2022
- Premium Statistic Revenue of anime production companies Japan 2022, by segment
- Premium Statistic Anime streaming market size Japan 2013-2022
- Premium Statistic Anime-related live entertainment market size Japan 2013-2022
- Premium Statistic Revenue distribution of animation production companies in Japan 2021, by segment
- Premium Statistic Playing home console or PC games participation rate Japan 1996-2021
- Premium Statistic Rate of people in Japan going to popular music concerts 1996-2021
- Premium Statistic Toei Company's total assets FY 2013-2022
- Premium Statistic Average internet usage time of youth per weekday Japan FY 2014-2021
Further related statistics
9
- The adidas Group's global footwear production from 2008-2023
- FIFA broadcasting revenue 2015-2023
- Grape production in China 2000-2022
- Number of digital 3D cinema screens worldwide 2016-2021
- Use of a smart TV to go online in the UK 2013-2020, by age
- Hours of internet use per week in the United Kingdom (UK) 2005-2019, by location
- Installed base of consumer electronics in U.S. households, by category
- Resources shoppers use most often to make purchase decisions in the UK 2013
- Media influencing final decisions about politics in the U.S. in 2011
Further Content: You might find this interesting as well
Statistics
- The adidas Group's global footwear production from 2008-2023
- FIFA broadcasting revenue 2015-2023
- Grape production in China 2000-2022
- Number of digital 3D cinema screens worldwide 2016-2021
- Use of a smart TV to go online in the UK 2013-2020, by age
- Hours of internet use per week in the United Kingdom (UK) 2005-2019, by location
- Installed base of consumer electronics in U.S. households, by category
- Resources shoppers use most often to make purchase decisions in the UK 2013
- Media influencing final decisions about politics in the U.S. in 2011
The Association of Japanese Animations. (March 1, 2016). Television production of animations in Japan from 2005 to 2015 (in 1,000 minutes) [Graph]. In Statista. Retrieved May 06, 2024, from https://www.statista.com/statistics/752122/japan-production-minutes-tv-animations/
The Association of Japanese Animations. "Television production of animations in Japan from 2005 to 2015 (in 1,000 minutes)." Chart. March 1, 2016. Statista. Accessed May 06, 2024. https://www.statista.com/statistics/752122/japan-production-minutes-tv-animations/
The Association of Japanese Animations. (2016). Television production of animations in Japan from 2005 to 2015 (in 1,000 minutes). Statista. Statista Inc.. Accessed: May 06, 2024. https://www.statista.com/statistics/752122/japan-production-minutes-tv-animations/
The Association of Japanese Animations. "Television Production of Animations in Japan from 2005 to 2015 (in 1,000 Minutes)." Statista, Statista Inc., 1 Mar 2016, https://www.statista.com/statistics/752122/japan-production-minutes-tv-animations/
The Association of Japanese Animations, Television production of animations in Japan from 2005 to 2015 (in 1,000 minutes) Statista, https://www.statista.com/statistics/752122/japan-production-minutes-tv-animations/ (last visited May 06, 2024)
Television production of animations in Japan from 2005 to 2015 (in 1,000 minutes) [Graph], The Association of Japanese Animations, March 1, 2016. [Online]. Available: https://www.statista.com/statistics/752122/japan-production-minutes-tv-animations/