Investing in technology stocks can be a tricky business. Take Apple for example: in the past six weeks, the company updated large parts of its product range to overall positive acclaim. Moreover, Apple just concluded its fiscal year with a record $42 billion profit. Yet for different reasons, little to do with business fundamentals, Apple’s stock price just dropped to a 3-month low.
Still, in the past years, some tech stocks have been among the best performers in overall difficult economic circumstances.
A $100 dollar investment in Apple stock, made five years ago, would now be worth $315. Amazon is another example for a tech company significantly outperforming the overall market.
There are other examples though: Yahoo’s share price has halved since October 2007 and $100 invested in Hewlett-Packard are worth no more than $28 today.
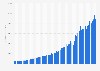
5-Year Performance of Tech Stocks


Description
This chart shows the 5-year performance of selected technology stocks, based on a virtual $100 dollar investment made in October 2007.