German  |  English
AOL Returns to Growth After 8 Years
 

AOL Returns to Growth After 8 Years

by Felix Richter, 11.02.2013

This chart shows AOL's revenue growth since the first quarter of 2008. In the fourth quarter of 2012, the former internet heavyweight returned to positive growth after 8 years of declining revenues.

Former internet heavyweight AOL announced its first quarterly revenue growth in 8 years on Friday. Fourth quarter sales rose 3.9 percent to $599.5 million spurred by a 12.9 percent increase of advertising revenues. AOL’s stock price jumped more than 7 percent on Friday, as the company continues its climb back to relevance. AOL’s stock has surged 115 percent over the past 12 months, making it one of the hottest tech stocks of the past year.

The latest results mark a milestone in CEO Tim Armstrong’s quest to transform his company from an internet service provider into a digital media company. Since AOL’s spin-off from Time Warner in 2009, the company had acquired TechCrunch and The Huffington Post to re-position itself as an ad-selling provider of premium online content.

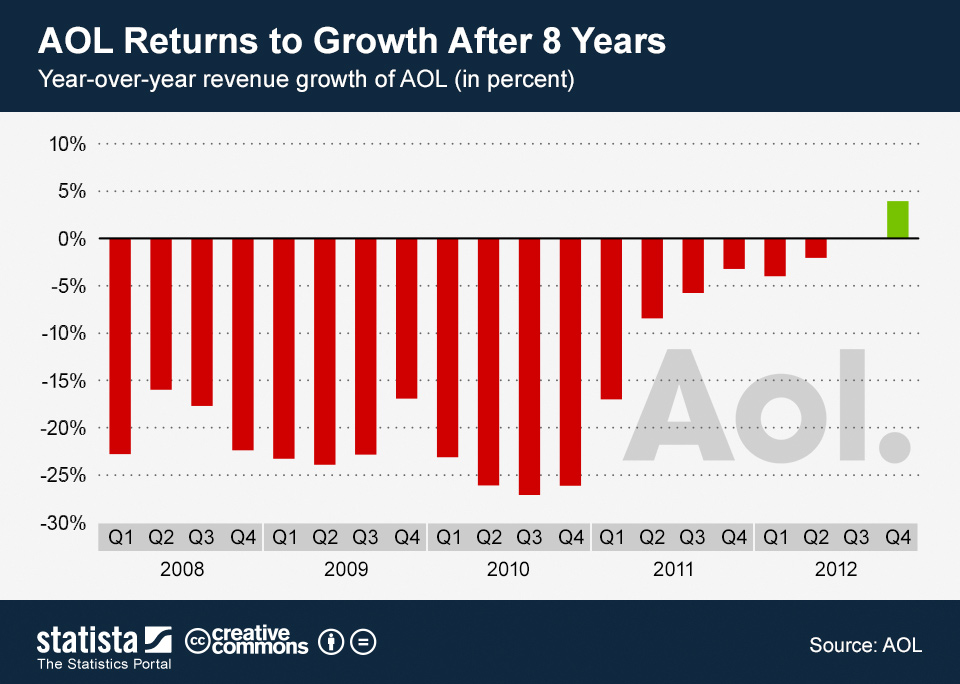
The above chart nicely illustrates the slow progress AOL has made in the past 2 years.

Show more statistics on the topic:
Newsletter
 

Yes, please send me a daily reminder for the 'Chart of the Day':

Contact
 
Felix Richter
Felix Richter
Media Relations Manager felix.richter@statista.com

+1 (212) 960 8349
Google+
Download & Reference
 

Download JPG Download Chart
URL to be used as reference link:

FAQ
 

Who may use the "Chart of the Day"?
The Statista "Chart of the Day", made available under the Creative Commons License CC BY-ND 3.0, may be used and displayed without charge by all commercial and non-commercial websites. Use is, however, only permitted with the inclusion of the Statista reference link provided alongside the Chart of the Day.

Which topics are covered by the "Chart of the Day"?
The Statista "Chart of the Day" currently focuses on two sectors: "Media and Technology", updated daily and featuring the latest statistics from the media, internet, telecommunications and consumer electronics industries; and "Economy and Society", which includes current data in the United States, as and when it becomes available, relating to economic and political issues.

Can Statista create customized charts?
Absolutely! For information on tailor-made and sector-specific Charts of the Day, please contact Felix Richter (felix.richter@statista.com).