When Apple releases the results of the December quarter on Wednesday, the question of whether or not iPhone demand is weakening, will finally be answered.
For weeks now, analysts, bloggers and other industry experts have speculated about waning demand, as anonymous supply sources reported that Apple had significantly cut orders of iPhone parts.
The 2011 holiday quarter was Apple’s strongest iPhone quarter to date. Back then, Apple shipped 37 million iPhones. A number the company should easily beat this year to calm the nerves of its shareholders. Analysts are expecting 47 to 50 million shipped iPhones for the December quarter and any number below that threshold would likely send Apple’s shares tumbling.
Samsung, Apple’s biggest rival in the smartphone game, has no such worries. Samsung’s popular Galaxy smartphones are selling like hot cakes, and analysts are projecting that the Korean electronics giant shipped more than 60 million smartphones in the past quarter.
What’s interesting is the fact that Samsung’s smartphone shipments have steadily increased over the past three years, while Apple has been much more vulnerable to seasonal variations and iPhone lifecycles. Samsung’s larger product line up helps the company to stretch releases throughout the year, whereas Apple’s iPhone shipments regularly take a hit ahead of the company’s annual iPhone refresh.
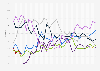
Can Apple Narrow the Gap on Samsung?


Description
This chart shows the number of smartphones shipped by Apple and Samsung from Q4 2009 through Q3 2012.