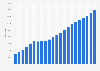
German  |  English
Features for this Premium Statistic
 

Do you have a question or a suggestion for this statistic? Please visit our contact page.
More statistics about...
 
You may also be interested in...
 
Recommended Websites
 

Do you know of an interesting website related to this topic? Suggest here

Sales of Starbucks by product type 2012 (fee-based)


Retail sales mix of company-operated Starbucks stores worldwide from 2005 to 2012

Do you want to view this graph? Sign up for a Premium Account and benefit from the following extras:

  • Quick and convenient access to all statistics
  • More than 1.5 million statistics and facts
  • All data downloadable in PPT, XLS and JPG format

Get Account Source Get Account


© Statista 2013

Reading support:
The statistic depicts the retail sales of Starbucks by product type from 2005 to 2012. In 2011, Starbucks generated 77 percent of its retail sales with beverages.
Revenue of Starbucks

Statistic Information
 
Survey
Survey by  Get Account
Survey time period 2005 to 2012
Object of investigation Starbucks retail sales mix
Region Worldwide
Macroregion Trans-Continental only (with GER)
Type time series
Category business volume
Relevance 3
Release
Published by  Get Account
Source link  Get Account
Release date November 2012
Further information  Get Account
Popular statistics
 
Viewed by other users
 
Latest statistics
 
Related reports
 
to: Starbucks, revenue distribution, retail sales, sales mix
How you can access Statista