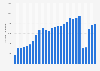
As of December 31, 2020, there were some 12,400 available hotel rooms in the city of Barcelona (Spain), the lowest number in decades. Thus, the impact of the pandemic of COVID-19 becomes clear in Catalonia's capital city, one of the
Evolution of the number of hotel rooms in Barcelona from 1990 to 2020
Basic Account
Get to know the platform
You only have access to basic statistics.
This statistic is not included in your account.
Single Account
The ideal entry-level account for individual users
- Instant access to 1m statistics
- Download in XLS, PDF & PNG format
- Detailed references
$59 $39 / Month *
in the first 12 months
Corporate Account
Full access
Corporate solution including all features.
* Prices do not include sales tax.
Further Content: You might find this interesting as well
Statistics
- Hotel occupancy in Taiwan 2019
- Monthly number of hotel rooms in the Community of Madrid (Spain) 2016
- Monthly number of hotel rooms in the city of Madrid (Spain) in 2020
- Revenue generated with hotel rooms in China 2009-2019
- Italy: average size of hotel rooms in 2010-2016
- Number of rooms in hotel facilities in Italy 2019, by region
- Number of hotel, motel and inn rooms Myanmar 2010-2018
- Brazil: distribution of hotel rooms in 2018, by hotel type
- Revenue per available room in hotels in Finland 2020, by city
- Brazil: number of hotel rooms in 2018, by hotel type
- Revenue per available room in hotels in Finland 2018, by region
- Brazil: number of rooms of Novotel hotels 2016-2018
- Distribution of hotel stays in French Polynesia by country of residence 2017
- Available hotel rooms in South Africa 2012-2023
- Number of Accor hotel rooms globally, by region 2019
- HolidayCheck: ranking of best rated hotels in Spain 2017
- Real restaurants & hotels consumer spending forecast in Laos 2010-2025
- Response of U.S. travelers to hotel towel reuse programs as of April 2014
- Restaurants & hotels consumer spending per capita forecast in Thailand 2010-2025
- Real restaurants & hotels consumer spending per capita forecast in Zambia 2010-2025
Gremio de Hoteles de Barcelona. (January 31, 2021). Evolution of the number of hotel rooms in Barcelona from 1990 to 2020 [Graph]. In Statista. Retrieved April 13, 2021, from https://www.statista.com/statistics/743014/annual-hotel-room-numbers-in-barcelona-spain/
Gremio de Hoteles de Barcelona. "Evolution of the number of hotel rooms in Barcelona from 1990 to 2020." Chart. January 31, 2021. Statista. Accessed April 13, 2021. https://www.statista.com/statistics/743014/annual-hotel-room-numbers-in-barcelona-spain/
Gremio de Hoteles de Barcelona. (2021). Evolution of the number of hotel rooms in Barcelona from 1990 to 2020. Statista. Statista Inc.. Accessed: April 13, 2021. https://www.statista.com/statistics/743014/annual-hotel-room-numbers-in-barcelona-spain/
Gremio de Hoteles de Barcelona. "Evolution of The Number of Hotel Rooms in Barcelona from 1990 to 2020." Statista, Statista Inc., 31 Jan 2021, https://www.statista.com/statistics/743014/annual-hotel-room-numbers-in-barcelona-spain/
Gremio de Hoteles de Barcelona, Evolution of the number of hotel rooms in Barcelona from 1990 to 2020 Statista, https://www.statista.com/statistics/743014/annual-hotel-room-numbers-in-barcelona-spain/ (last visited April 13, 2021)