
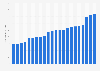


Average team valuation in Major League Baseball 2002-2023
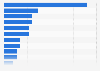
In 2023, the average franchise value in Major League Baseball was 2.32 billion U.S. dollars. The highest valued MLB franchise in 2022 was the New York Yankees with a franchise value of 7.1 billion U.S. dollars.


