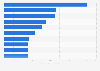
This statistic represents the leading states in hydropower generation in the United States in 2018. With a generation of approximately 10,068 megawatts, California was ranked second that year. Installed hydropower capacity is primarily concentrated in western United States.
Leading states in hydroelectric power capacity in the United States in 2018
(in megawatts)
Profit from the additional features of your individual account
Currently, you are using a shared account. To use individual functions (e.g., mark statistics as favourites, set
statistic alerts) please log in with your personal account.
If you are an admin, please authenticate by logging in again.
Learn more about how Statista can support your business.
US Department of Energy. (February 15, 2020). Leading states in hydroelectric power capacity in the United States in 2018 (in megawatts) [Graph]. In Statista. Retrieved September 20, 2024, from https://www.statista.com/statistics/183490/leading-states-in-hydropower-generation-in-the-us/
US Department of Energy. "Leading states in hydroelectric power capacity in the United States in 2018 (in megawatts)." Chart. February 15, 2020. Statista. Accessed September 20, 2024. https://www.statista.com/statistics/183490/leading-states-in-hydropower-generation-in-the-us/
US Department of Energy. (2020). Leading states in hydroelectric power capacity in the United States in 2018 (in megawatts). Statista. Statista Inc.. Accessed: September 20, 2024. https://www.statista.com/statistics/183490/leading-states-in-hydropower-generation-in-the-us/
US Department of Energy. "Leading States in Hydroelectric Power Capacity in The United States in 2018 (in Megawatts)." Statista, Statista Inc., 15 Feb 2020, https://www.statista.com/statistics/183490/leading-states-in-hydropower-generation-in-the-us/
US Department of Energy, Leading states in hydroelectric power capacity in the United States in 2018 (in megawatts) Statista, https://www.statista.com/statistics/183490/leading-states-in-hydropower-generation-in-the-us/ (last visited September 20, 2024)
Leading states in hydroelectric power capacity in the United States in 2018 (in megawatts) [Graph], US Department of Energy, February 15, 2020. [Online]. Available: https://www.statista.com/statistics/183490/leading-states-in-hydropower-generation-in-the-us/