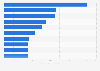
From 2009 to 2023, pumped-storage hydropower generation in Spain experienced fluctuations. Electricity generation from pumped-storage peaked in 2023 with a generation of 5,195 gigawatt-hours. A year earlier, generation stood at 3,776 gigawatt-hours.
Annual electricity generation from pumped-storage hydropower in Spain from 2010 to 2023
(in gigawatt-hours)
Characteristic
Electricity generation in GWh
-
-
-
-
-
-
-
-
-
-
-
-
-
-
-
-
-
-
-
-
-
-
-
-
-
-
-
-
Exclusive Premium Statistic
To access all Premium Statistics, you need a paid Statista Account
Profit from the additional features of your individual account
Currently, you are using a shared account. To use individual functions (e.g., mark statistics as favourites, set
statistic alerts) please log in with your personal account.
If you are an admin, please authenticate by logging in again.
Learn more about how Statista can support your business.
REE. (January 19, 2024). Annual electricity generation from pumped-storage hydropower in Spain from 2010 to 2023 (in gigawatt-hours) [Graph]. In Statista. Retrieved July 27, 2024, from https://www.statista.com/statistics/1006420/pumped-storage-hydroelectricity-generation-in-spain/
REE. "Annual electricity generation from pumped-storage hydropower in Spain from 2010 to 2023 (in gigawatt-hours)." Chart. January 19, 2024. Statista. Accessed July 27, 2024. https://www.statista.com/statistics/1006420/pumped-storage-hydroelectricity-generation-in-spain/
REE. (2024). Annual electricity generation from pumped-storage hydropower in Spain from 2010 to 2023 (in gigawatt-hours). Statista. Statista Inc.. Accessed: July 27, 2024. https://www.statista.com/statistics/1006420/pumped-storage-hydroelectricity-generation-in-spain/
REE. "Annual Electricity Generation from Pumped-storage Hydropower in Spain from 2010 to 2023 (in Gigawatt-hours)." Statista, Statista Inc., 19 Jan 2024, https://www.statista.com/statistics/1006420/pumped-storage-hydroelectricity-generation-in-spain/
REE, Annual electricity generation from pumped-storage hydropower in Spain from 2010 to 2023 (in gigawatt-hours) Statista, https://www.statista.com/statistics/1006420/pumped-storage-hydroelectricity-generation-in-spain/ (last visited July 27, 2024)
Annual electricity generation from pumped-storage hydropower in Spain from 2010 to 2023 (in gigawatt-hours) [Graph], REE, January 19, 2024. [Online]. Available: https://www.statista.com/statistics/1006420/pumped-storage-hydroelectricity-generation-in-spain/