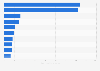
This statistic shows the average spending on selected business trip costs in Canada in 2013. Canadians spent an average of 100 Canadian dollars on food and beverages in restaurants when traveling for business in 2013.
Average spending on selected business trip costs in Canada in 2013 (in CAD)
Basic Account
Get to know the platform
You only have access to basic statistics.
This statistic is not included in your account.
Single Account
The ideal entry-level account for individual users
- Instant access to 1m statistics
- Download in XLS, PDF & PNG format
- Detailed references
$59 $39 / Month *
in the first 12 months
Corporate Account
Full access
Corporate solution including all features.
* Prices do not include sales tax.
Further Content: You might find this interesting as well
Statistics
- Cost of international and domestic business trips in the U.S. 2010-2014
- International business travel spending in the UK 2019, by accommodation used
- Opinions of business travelers on their expense reporting experience in the U.S. 2015
- Average daily spending per person on business trips in Germany 2006-2019
- Inbound business visitor spending in Scotland 2009-2019
- Business travel spending growth forecast for leading markets in 2014 and 2015
- Global business travel spending growth forecast 2015-2020
- Annual growth in business travel spending in the U.S. 2010-2017
- Business travel spending in South Korea 2011-2016
- Business travel spending in Brazil 2010-2017
- Business travel spending in Spain 2010-2017
- Business travel spending in Germany 2010-2017
- Change in international and domestic business air travel costs in the U.S. 2011-2014
- Change in international and domestic business car rental costs in the U.S. 2011-2014
- Change in international and domestic business hotel costs in the U.S. 2011-2014
- Most important hotel amenities for U.S. travelers on a business trip 2017
- Italy: entertainment spending of World Chambers Congress participants by amount 2015
- Contribution of travel and tourism to GDP Egypt 2017, by segment
- Average number of business trips taken by U.S. adults 2012
- Business visits to the UK from Oceania in 2017, by gender and country of residence
GBTA. (April 22, 2015). Average spending on selected business trip costs in Canada in 2013 (in CAD) [Graph]. In Statista. Retrieved January 27, 2021, from https://www.statista.com/statistics/422506/average-spending-on-selected-business-trip-costs-canada/
GBTA. "Average spending on selected business trip costs in Canada in 2013 (in CAD)." Chart. April 22, 2015. Statista. Accessed January 27, 2021. https://www.statista.com/statistics/422506/average-spending-on-selected-business-trip-costs-canada/
GBTA. (2015). Average spending on selected business trip costs in Canada in 2013 (in CAD). Statista. Statista Inc.. Accessed: January 27, 2021. https://www.statista.com/statistics/422506/average-spending-on-selected-business-trip-costs-canada/
GBTA. "Average Spending on Selected Business Trip Costs in Canada in 2013 (in Cad)." Statista, Statista Inc., 22 Apr 2015, https://www.statista.com/statistics/422506/average-spending-on-selected-business-trip-costs-canada/
GBTA, Average spending on selected business trip costs in Canada in 2013 (in CAD) Statista, https://www.statista.com/statistics/422506/average-spending-on-selected-business-trip-costs-canada/ (last visited January 27, 2021)