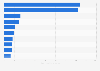
This statistic displays the number of quarterly business nights from Italy in the United Kingdom (UK) in 2015, by gender. The number of overnight stays by female business visitors increased from 140.9 thousand between January and March to 629 thousand between April and June 2015.
Number of quarterly business nights from Italy in the United Kingdom (UK) in 2015, by gender
Loading statistic...
Basic Account
Get to know the platform
You only have access to basic statistics.
Starter Account
The ideal entry-level account for individual users
- Instant access to 1m statistics
- Download in XLS, PDF & PNG format
- Detailed references
$199 USD / Month *
Professional Account
Full access
Business Solutions including all features.
* Prices do not include sales tax.
Other statistics that may interest you Statistics on
About the industry
10
- Premium Statistic Quarterly inbound business trips in the UK 2015-2021
- Basic Statistic Overnight stays in hotels by business travelers in Maastricht 2012-2022
- Basic Statistic Overnight stays in hotels by business travelers in Rotterdam 2012-2022
- Basic Statistic Overnight stays in hotels by business travelers in Amsterdam 2012-2022
- Premium Statistic Inbound tourism volume in Spain 2023, by travel reason
- Premium Statistic Number of outbound trips from Finland 2022, by country of destination
- Basic Statistic Distribution of travel and tourism expenditure in Europe 2019-2022, by type
- Premium Statistic Expenditure of inbound tourists in Italy 2014-2020, by travel reason
- Basic Statistic Number of business-related overnight stays in hotels in The Hague 2012-2019
- Basic Statistic Number of business-related overnight stays in hotels in Utrecht 2012-2019
About the region
10
- Basic Statistic Inbound business travel spending in the United Kingdom (UK) Q1 2015-Q1 2020
- Premium Statistic Inbound business travel spending in the UK 1980-2021
- Basic Statistic Inbound holiday travel spending in the United Kingdom (UK) Q1 2015-Q1 2020
- Premium Statistic Inbound travel spending: North America business visitors to the UK 2011-2019
- Premium Statistic Inbound business visits to the United Kingdom (UK) 2011-2019
- Premium Statistic Inbound tourism spending in Montserrat 2010-2022
- Premium Statistic British tourism spending in Spain 2010-2022
- Premium Statistic Inbound business trips to London 2009-2021
- Premium Statistic International business travel spending in London 2009-2021
- Premium Statistic Main European countries for inbound business travel spending in the UK 2021
Selected statistics
1
Other regions
10
- Premium Statistic Arrivals of foreign tourists in China in 2015, by reason for traveling
- Premium Statistic Business travel direct spending in the U.S. 2013-2021, by segment
- Premium Statistic Total trip expenditure of international visitors Australia 2018 by reason
- Premium Statistic Global business travel spending forecast 2023-2027
- Premium Statistic Inbound business travel spending in Italy 2015-2022
- Premium Statistic Monthly number of overnight visitors in the city of Madrid 2019-2022
- Basic Statistic Business trips by French travelers 2017, by month of return
- Premium Statistic Usage of sharing economy platforms among business travelers the Netherlands Q1 2016
- Basic Statistic Economic contribution of tourism in England (UK) 2013
- Basic Statistic Number of outbound trips made from Luxembourg 1999-2019
Related statistics
9
- Premium Statistic Global business travel spending 2001-2022
- Premium Statistic Share of inbound business travel spending in Italy 2015-2022
- Premium Statistic Average per capita spending of inbound business travelers in Italy 2015-2020
- Premium Statistic International tourism receipts in Andalusia 2010-2020
- Premium Statistic Average length of stay of foreign tourists in Spain in 2019, by purpose of the trip
- Premium Statistic French tourists in Spain 2010-2022
- Premium Statistic Per capita daily spend of inbound tourists in the Community of Madrid 2010-2022
- Premium Statistic Average length of stay by inbound tourists in the Balearic Islands 2010-2022
- Premium Statistic Average international tourist spend per trip in Catalonia 2016-2022
Further related statistics
10
- Change in number of visitors from Mexico to the U.S. 2018-2024
- Countries with the highest number of inbound tourist arrivals worldwide 2019-2022
- Contribution of China's travel and tourism industry to GDP 2014-2023
- Number of international tourist arrivals APAC 2019, by country or region
- Leading countries in the MEA in the Travel & Tourism Competitiveness Index 2018
- The U.S. meetings industry: distribution of meetings by facility 2009
- Annual revenue of China Tourism Group Duty Free 2013-2023
- Countries with the highest outbound tourism expenditure worldwide 2019-2022
- Number of international tourist arrivals in India 2010-2021
- International tourism receipts of India 2011-2022
Further Content: You might find this interesting as well
Statistics
- Change in number of visitors from Mexico to the U.S. 2018-2024
- Countries with the highest number of inbound tourist arrivals worldwide 2019-2022
- Contribution of China's travel and tourism industry to GDP 2014-2023
- Number of international tourist arrivals APAC 2019, by country or region
- Leading countries in the MEA in the Travel & Tourism Competitiveness Index 2018
- The U.S. meetings industry: distribution of meetings by facility 2009
- Annual revenue of China Tourism Group Duty Free 2013-2023
- Countries with the highest outbound tourism expenditure worldwide 2019-2022
- Number of international tourist arrivals in India 2010-2021
- International tourism receipts of India 2011-2022
VisitBritain. (January 4, 2016). Number of quarterly business nights from Italy in the United Kingdom (UK) in 2015, by gender [Graph]. In Statista. Retrieved April 26, 2024, from https://www.statista.com/statistics/526770/business-nights-italy-united-kingdom-uk-by-quarter-and-by-gender/
VisitBritain. "Number of quarterly business nights from Italy in the United Kingdom (UK) in 2015, by gender." Chart. January 4, 2016. Statista. Accessed April 26, 2024. https://www.statista.com/statistics/526770/business-nights-italy-united-kingdom-uk-by-quarter-and-by-gender/
VisitBritain. (2016). Number of quarterly business nights from Italy in the United Kingdom (UK) in 2015, by gender. Statista. Statista Inc.. Accessed: April 26, 2024. https://www.statista.com/statistics/526770/business-nights-italy-united-kingdom-uk-by-quarter-and-by-gender/
VisitBritain. "Number of Quarterly Business Nights from Italy in The United Kingdom (Uk) in 2015, by Gender." Statista, Statista Inc., 4 Jan 2016, https://www.statista.com/statistics/526770/business-nights-italy-united-kingdom-uk-by-quarter-and-by-gender/
VisitBritain, Number of quarterly business nights from Italy in the United Kingdom (UK) in 2015, by gender Statista, https://www.statista.com/statistics/526770/business-nights-italy-united-kingdom-uk-by-quarter-and-by-gender/ (last visited April 26, 2024)
Number of quarterly business nights from Italy in the United Kingdom (UK) in 2015, by gender [Graph], VisitBritain, January 4, 2016. [Online]. Available: https://www.statista.com/statistics/526770/business-nights-italy-united-kingdom-uk-by-quarter-and-by-gender/