The statistics shows the revenue generated by component for Madison Square Garden Company from 2014 to 2019. Its media rights revenues—primarily consisting of telecast right fees from MSG Networks and the company's share of league distributions—amounted to 239.14 million U.S. dollars in 2019.
Revenue by component of Madison Square Garden Company from 2014 to 2019 (in million U.S. dollars)
Basic Account
Get to know the platform
You only have access to basic statistics.
This statistic is not included in your account.
Starter Account
The ideal entry-level account for individual users
- Instant access to 1m statistics
- Download in XLS, PDF & PNG format
- Detailed references
$229 USD $199 USD / Month *
in the first 12 months
Professional Account
Full access
Business Solutions including all features.
* Prices do not include sales tax.
Other statistics that may interest you Statistics on
About the industry
9
- Premium Statistic Madison Square Garden Company total assets 2012-2020
- Premium Statistic 
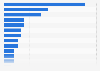
Madison Square Garden Company revenue by segment 2014-2019
- Basic Statistic Madison Square Garden company revenue 2017-2020
- Basic Statistic Madison Square Garden Company operating income/loss 2017-2020
- Premium Statistic Madison Square Garden Company net income/loss 2012-2020
- Premium Statistic Online sports bets in France 2021, by sport
- Premium Statistic Revenue of the first Football-Bundesliga 2010/2011-2019/2020, by source of revenue
- Premium Statistic Average turnover of Ligue 1 football clubs per club 2015-2018
- Premium Statistic Turnover of football clubs in France 2012-2018, by activity
About the region
6
- Basic Statistic Activities people will avoid once COVID-19 restrictions are lifted 2020
- Premium Statistic Operating revenue of Eversource Energy 2013-2019
- Basic Statistic Average player salary in the NHL 2019/20, by team
- Premium Statistic Total assets of Eversource Energy 2013-2018
- Premium Statistic Performing arts attendance, by performance type U.S. 2017
- Basic Statistic Average pro sports player salary in New York 2017, by team
Other regions
10
- Premium Statistic Salvatore Ferragamo: total assets 2013-2022
- Premium Statistic University of Cambridge group: consolidated expenditure by activity in the UK 2018
- Premium Statistic Prada Group: net financial position 2012-2022
- Premium Statistic Distribution of revenues of AIK Solna 2017-2019, by source
- Premium Statistic Revenue from music and non-music events in Germany 2008-2013
- Premium Statistic Licenses released by Olympic single-sport federations by sport in France 2017
- Premium Statistic Revenue of Koda 2019, by segment
- Premium Statistic Novaland's total assets 2016-2021
- Premium Statistic Leading trust banks in Japan 2023, by total assets
- Basic Statistic Assets and liabilities Quebec provincial government 2007-2021
Related statistics
10
- Premium Statistic Main high school sports programs for girls in U.S. 2010-2022
- Premium Statistic Most popular high school sports for boys in the U.S. 2010-2022
- Premium Statistic Champions League final viewers in the U.S. 2016-2022
- Premium Statistic Rugby Football Union (RFU) sponsorship revenue in England 2010-2021
- Premium Statistic Bundesliga clubs in the HORIZONT performance check category sponsors in Germany 2021
- Premium Statistic Number of licenses and participation titles in France 2019, by sports federation
- Premium Statistic Sport in France: number of clubs 2019, by sports federation
- Premium Statistic Box office and audience expenditure for team sports events in Italy 2019, by region
- Premium Statistic Team sports events other than soccer in Italy 2019, by macro-region
- Premium Statistic Admissions and attendance at sport events in Italy 2019, by region
Further related statistics
10
- Total assets of Wendy's 2009-2022
- Total assets of Choice Hotels International worldwide 2008-2022
- Total assets of Royal Caribbean Cruises worldwide 2007-2022
- Total assets of Hyatt Hotels Corporation worldwide 2008-2022
- Total assets of Mizuno 2015
- National Hockey League: venue renovation / construction costs 2010
- NBA - venue and stadium renovation / construction costs 1989-2009
- The adidas Group's EBITDA worldwide 2000-2022
- The adidas Group's financial leverage worldwide 2000-2022
- Adidas Group's global net sales from 2002 to 2022, by product category
Further Content: You might find this interesting as well
Statistics
- Total assets of Wendy's 2009-2022
- Total assets of Choice Hotels International worldwide 2008-2022
- Total assets of Royal Caribbean Cruises worldwide 2007-2022
- Total assets of Hyatt Hotels Corporation worldwide 2008-2022
- Total assets of Mizuno 2015
- National Hockey League: venue renovation / construction costs 2010
- NBA - venue and stadium renovation / construction costs 1989-2009
- The adidas Group's EBITDA worldwide 2000-2022
- The adidas Group's financial leverage worldwide 2000-2022
- Adidas Group's global net sales from 2002 to 2022, by product category
Madison Square Garden Company. (August 20, 2019). Revenue by component of Madison Square Garden Company from 2014 to 2019 (in million U.S. dollars) [Graph]. In Statista. Retrieved October 02, 2023, from https://www.statista.com/statistics/646121/revenue-by-component-of-madison-square-garden-company/
Madison Square Garden Company. "Revenue by component of Madison Square Garden Company from 2014 to 2019 (in million U.S. dollars)." Chart. August 20, 2019. Statista. Accessed October 02, 2023. https://www.statista.com/statistics/646121/revenue-by-component-of-madison-square-garden-company/
Madison Square Garden Company. (2019). Revenue by component of Madison Square Garden Company from 2014 to 2019 (in million U.S. dollars). Statista. Statista Inc.. Accessed: October 02, 2023. https://www.statista.com/statistics/646121/revenue-by-component-of-madison-square-garden-company/
Madison Square Garden Company. "Revenue by Component of Madison Square Garden Company from 2014 to 2019 (in Million U.S. Dollars)." Statista, Statista Inc., 20 Aug 2019, https://www.statista.com/statistics/646121/revenue-by-component-of-madison-square-garden-company/
Madison Square Garden Company, Revenue by component of Madison Square Garden Company from 2014 to 2019 (in million U.S. dollars) Statista, https://www.statista.com/statistics/646121/revenue-by-component-of-madison-square-garden-company/ (last visited October 02, 2023)
Revenue by component of Madison Square Garden Company from 2014 to 2019 (in million U.S. dollars) [Graph], Madison Square Garden Company, August 20, 2019. [Online]. Available: https://www.statista.com/statistics/646121/revenue-by-component-of-madison-square-garden-company/