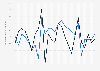
The monthly inflation rate in Indonesia stood at 0.09 percent as of November 2022, showing an increase from the previous month. The inflation rate in Indonesia averaged around nine percent from 1997 until 2021, reaching its peak at 82.40 percent in September 1998.
Monthly inflation rate in Indonesia from January 2016 to November 2022 (compared to the previous month)
Basic Account
Get to know the platform
You only have access to basic statistics.
This statistic is not included in your account.
Starter Account
The ideal entry-level account for individual users
- Instant access to 1m statistics
- Download in XLS, PDF & PNG format
- Detailed references
$59 USD $39 USD / Month *
in the first 12 months
Professional Account
Full access
Corporate solution including all features.
* Prices do not include sales tax.
Statistics on Consumer Price Index and inflation rate in China
Global overview
4
Inflation rate and Consumer Price Index (CPI)
7
- Basic Statistic Inflation rate in China 2011-2027
- Basic Statistic Monthly inflation rate in China December 2022
- Premium Statistic Inflation rate in China 2022, by sector
- Premium Statistic Monthly inflation rate in China in December 2022, by sector
- Premium Statistic Consumer Price Index (CPI) in China by sector and area December 2022
- Basic Statistic Consumer Price Index in China 2021, by region
- Basic Statistic Monthly Consumer Price Index (CPI) in China by region December 2022
Retail price inflation
8
- Basic Statistic Monthly food retail price inflation rate in China 2020-2022
- Basic Statistic Monthly clothes retail price inflation rate in China 2020-2022
- Basic Statistic Monthly daily necessities retail price inflation rate in China 2020-2022
- Basic Statistic Monthly cosmetics retail price inflation rate in China 2020-2022
- Basic Statistic Monthly jewelry retail price inflation rate in China 2020-2022
- Basic Statistic Monthly fuels retail price inflation in China 2020-2022
- Basic Statistic Monthly home appliances retail price inflation in China 2020-2022
- Basic Statistic Monthly furniture retail price inflation in China 2020-2022
Producer Price Index (PPI)
7
- Premium Statistic Producer Price Index for the industrial sector in China December 2022
- Premium Statistic Ex factory producer prices for the industrial sector in China 2022, by product
- Premium Statistic Producer Price Index of agricultural products in China Q4 2019-Q4 2022
- Premium Statistic Producer Price Index for farm crops in China Q4 2019-Q4 2022
- Premium Statistic Producer Price Index for livestock in China Q4 2019-Q4 2022
- Premium Statistic Producer Price Index for forestry products in China Q4 2019-Q4 2022
- Premium Statistic Producer Price Index for fishery in China Q4 2019-Q4 2022
Household consumption and expenditure
8
- Basic Statistic Total consumption as a share of GDP in China 1980-2021
- Premium Statistic Consumer confidence in China 2017-2022
- Premium Statistic Per capita disposable income in urban and rural China 1990-2022
- Premium Statistic Per capita consumer spending in urban and rural China 1990-2022
- Premium Statistic Urban and rural household consumer expenditure in China 2021, by region
- Premium Statistic Per capita consumption in urban and rural China 2022, by use
- Premium Statistic Consumer spending distribution of urban and rural households in China 2022, by use
- Premium Statistic Urban household expenditure share in China 1990-2017, by type of products
Further related statistics
20
- Indices of cost of living in Saudi Arabia 2014-2020
- Indices for consumer price for goods and services in the GCC by country 2016
- Indices for consumer price for education in the GCC by country 2016
- Indices for cost of living for misc goods and services in Saudi Arabia 2014-2020
- Indices for consumer price for culture and entertainment in the GCC by country 2016
- Indices for cost of living for restaurants and hotels in Saudi Arabia 2014-2020
- Indices for consumer price for health in the GCC by country 2016
- Indices for consumer price for housing and utilities in the GCC by country 2016
- Indices for cost of living in Saudi Arabia 2020, by category
- Indices for consumer price for food and beverages in the GCC by country 2016
- Indices for consumer price for restaurants and hotels in the GCC by country 2016
- Indices for consumer price in the GCC by category 2016
- Indices for cost of living for education in Saudi Arabia 2014-2020
- Netherlands annual derived inflation rate 1994-2022
- Indices for consumer for furniture & household goods in the GCC by country 2016
- Indices for cost of living for communication in Saudi Arabia 2014-2020
- Rate of inflation for food in France 2015-2021
- Rate of inflation hotels, restaurants and bars in Belgium 2018-2022
- GDP of the UK 2020, by local region
- Production index of the mechanical and electrical industry in Tunisia 2019-2021
Further Content: You might find this interesting as well
Statistics
- Indices of cost of living in Saudi Arabia 2014-2020
- Indices for consumer price for goods and services in the GCC by country 2016
- Indices for consumer price for education in the GCC by country 2016
- Indices for cost of living for misc goods and services in Saudi Arabia 2014-2020
- Indices for consumer price for culture and entertainment in the GCC by country 2016
- Indices for cost of living for restaurants and hotels in Saudi Arabia 2014-2020
- Indices for consumer price for health in the GCC by country 2016
- Indices for consumer price for housing and utilities in the GCC by country 2016
- Indices for cost of living in Saudi Arabia 2020, by category
- Indices for consumer price for food and beverages in the GCC by country 2016
- Indices for consumer price for restaurants and hotels in the GCC by country 2016
- Indices for consumer price in the GCC by category 2016
- Indices for cost of living for education in Saudi Arabia 2014-2020
- Netherlands annual derived inflation rate 1994-2022
- Indices for consumer for furniture & household goods in the GCC by country 2016
- Indices for cost of living for communication in Saudi Arabia 2014-2020
- Rate of inflation for food in France 2015-2021
- Rate of inflation hotels, restaurants and bars in Belgium 2018-2022
- GDP of the UK 2020, by local region
- Production index of the mechanical and electrical industry in Tunisia 2019-2021
Website (inflation.eu). (December 8, 2022). Monthly inflation rate in Indonesia from January 2016 to November 2022 (compared to the previous month) [Graph]. In Statista. Retrieved February 07, 2023, from https://www.statista.com/statistics/861084/indonesia-monthly-inflation-rate/
Website (inflation.eu). "Monthly inflation rate in Indonesia from January 2016 to November 2022 (compared to the previous month)." Chart. December 8, 2022. Statista. Accessed February 07, 2023. https://www.statista.com/statistics/861084/indonesia-monthly-inflation-rate/
Website (inflation.eu). (2022). Monthly inflation rate in Indonesia from January 2016 to November 2022 (compared to the previous month). Statista. Statista Inc.. Accessed: February 07, 2023. https://www.statista.com/statistics/861084/indonesia-monthly-inflation-rate/
Website (inflation.eu). "Monthly Inflation Rate in Indonesia from January 2016 to November 2022 (Compared to The Previous Month)." Statista, Statista Inc., 8 Dec 2022, https://www.statista.com/statistics/861084/indonesia-monthly-inflation-rate/
Website (inflation.eu), Monthly inflation rate in Indonesia from January 2016 to November 2022 (compared to the previous month) Statista, https://www.statista.com/statistics/861084/indonesia-monthly-inflation-rate/ (last visited February 07, 2023)
Monthly inflation rate in Indonesia from January 2016 to November 2022 (compared to the previous month) [Graph], Website (inflation.eu), December 8, 2022. [Online]. Available: https://www.statista.com/statistics/861084/indonesia-monthly-inflation-rate/