This statistic shows the revenue of the gambling industry in Canada by gaming segment in 2017. In 2017 the casino segment of the Canadian gambling industry accounted for 5.85 billion U.S. dollars in revenue.
Total revenue of the gambling industry in Canada by gaming segment in 2017 (in billion US dollars)
Basic Account
Get to know the platform
You only have access to basic statistics.
This statistic is not included in your account.
Single Account
The ideal entry-level account for individual users
- Instant access to 1m statistics
- Download in XLS, PDF & PNG format
- Detailed references
$59 $39 / Month *
in the first 12 months
Corporate Account
Full access
Corporate solution including all features.
* Prices do not include sales tax.
Further Content: You might find this interesting as well
Statistics
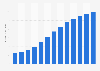
- Gambling revenue in Canada by gaming segment 2016-2017
- Tax and fee revenue of the gambling industry in the U.S. 2014-2015, by gambling type
- Number of Gala Coral Group casino premises in Great Britain 2011-2015
- Revenue of casino gaming in Sweden from 2010 to 2017
- Revenue of the Indian gaming industry in the U.S. 2006-2019
- Revenue of casino gaming in Italy from 2010 to 2012
- Revenue of casino gaming in Luxembourg from 2013 to 2017
- Revenue of casino gaming in Hungary from 2010 to 2017
- Revenue of casino gaming in Denmark from 2010 to 2017
- Machines and game activities among men in England in 2012, by age
- Casino gambling spending New Zealand FY 2011-2018
- Total number of Holland Casino Amsterdam visitors in the Netherlands 2013-2019
- Credit card purchases in gambling sector in the United Kingdom (UK) 2015-2017
- Industry revenue of “casinos (except casino hotels)“ in the U.S. 2012-2024
- Number of global gaming machine installations 2010-2019
- Number of gaming machines per capita, by country 2018
- Number of slot gaming machines 2012-2016
- Gaming machine count in Canadian states 2019
- Great Britain: distribution of annual gambling fee income in 2018/2019, by sector
- Great Britain: share of youths who played National Lottery games weekly 2018, by age
Fantini Research. (March 26, 2018). Total revenue of the gambling industry in Canada by gaming segment in 2017 (in billion US dollars) [Graph]. In Statista. Retrieved March 04, 2021, from https://www.statista.com/statistics/935255/canada-gambling-revenue-by-segment/
Fantini Research. "Total revenue of the gambling industry in Canada by gaming segment in 2017 (in billion US dollars)." Chart. March 26, 2018. Statista. Accessed March 04, 2021. https://www.statista.com/statistics/935255/canada-gambling-revenue-by-segment/
Fantini Research. (2018). Total revenue of the gambling industry in Canada by gaming segment in 2017 (in billion US dollars). Statista. Statista Inc.. Accessed: March 04, 2021. https://www.statista.com/statistics/935255/canada-gambling-revenue-by-segment/
Fantini Research. "Total Revenue of The Gambling Industry in Canada by Gaming Segment in 2017 (in Billion Us Dollars)." Statista, Statista Inc., 26 Mar 2018, https://www.statista.com/statistics/935255/canada-gambling-revenue-by-segment/
Fantini Research, Total revenue of the gambling industry in Canada by gaming segment in 2017 (in billion US dollars) Statista, https://www.statista.com/statistics/935255/canada-gambling-revenue-by-segment/ (last visited March 04, 2021)