
Ahmed Sherif
Research expert covering IT services and gaming hardware

Smartphone users by country worldwide 2022
Number of smartphone users by leading countries in 2022 (in millions)

Global market share held by internet browsers 2012-2024, by month
Global market share held by leading internet browsers from January 2012 to August 2024

Market share of mobile operating systems worldwide 2009-2024, by quarter
Market share of mobile operating systems worldwide from 2009 to 2024, by quarter

Market share of tablet operating systems worldwide 2016-2023, by quarter
Market share of tablet operating systems worldwide from 2016 to 2024, by quarter
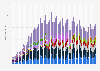
Global smartphone shipments by vendor 2009-2024
Smartphone shipments by vendor worldwide from 4th quarter 2009 to 2nd quarter 2024 (in million units)

Quarterly smartphone market share worldwide by vendor 2009-2024
Global smartphone market share from 4th quarter 2009 to 2nd quarter 2024, by vendor

Mobile Android version market share worldwide 2018-2024
Mobile Android operating system market share worldwide from January 2018 to February 2024, by version

Average selling price of Android smartphones worldwide 2017 to 2023
Average selling price (ASP) of Android smartphones worldwide from 2017 to 2023 (in U.S. dollars)
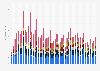
Tablet vendor shipments worldwide 2012-2024, by quarter
Tablet vendor shipments worldwide from 2011 to 2024, by quarter (in millions)

Global market share held by tablet vendors 2011-2024
Tablet shipments market share by vendor worldwide from 2nd quarter 2011 to 2nd quarter 2024
Global tablet shipments by operating system per quarter 2010-2022
Tablet shipments worldwide by operating system from 2010 to 2022 (in million units)

Tablet Android version market share worldwide 2018-2023, by quarter
Tablet Android operating system market share by version worldwide 2018 to 2023, by quarter

Global market share held by computer operating systems 2012-2024, by month
Market share held by the leading computer (desktop/tablet/console) operating systems worldwide from January 2012 to February 2024

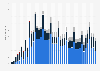
Google Play: number of available apps 2017-2024
Number of available applications in the Google Play Store from March 2017 to June 2024

Leading Android apps worldwide 2023, by downloads
Leading Android apps in the Google Play Store worldwide in June 2023, by number of downloads (in millions)

Global Android app retention rate Q3 2023
Android app retention rates worldwide in 3rd quarter 2023

Distribution of free and paid Android apps 2019-2024
Distribution of free and paid Android apps in the Google Play Store from June 2019 to March 2024

Star ratings for Android apps 2022, by app category
Distribution of star ratings for Android mobile apps in 2022, by app category

Share of mobile operating systems in the United States 2012-2024, by month
Market share of mobile operating systems in the United States from January 2012 to February 2024

Market share of Android operating system in the U.S. 2017-2024
Market share of Android operating system in the United States from June 2017 to February 2024

Market share of mobile operating systems in Europe 2010-2023
Market share of leading mobile operating systems in Europe from 2010 to 2023

Market share of mobile operating systems in Germany 2010-2023
Market share of mobile operating systems in Germany from 2010 to 2023

Mobile OS market share in the United Kingdom (UK) 2011-2024
Market share held by mobile operating systems in the United Kingdom (UK) from December 2011 to June 2024

Mobile Android OS version market share in the United Kingdom 2017-2023
Mobile Android OS market share in the United Kingdom (UK) from 2017 to 2023, by version

Market share of mobile operating systems in Spain 2010-2024
Market share of mobile operating systems in Spain from 2010 to 2024

Market share of mobile operating systems in Italy 2010-2022
Market share of mobile operating systems in Italy from 2010 to 2022


Mon - Fri, 9am - 6pm (EST)
Mon - Fri, 9am - 5pm (SGT)
Mon - Fri, 10:00am - 6:00pm (JST)
Mon - Fri, 9:30am - 5pm (GMT)
Mon - Fri, 9am - 6pm (EST)


