Share of Americans who follow the NHL in the U.S. 2021, by generation
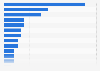
This statistic shows the share of Americans who follow the NHL as of 2021, by generation. In that year, 4 percent of Gen Z respondents stated that they follow the NHL.