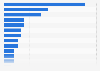
In 2023, the average TV rating for the Stanley Cup championship games between the Vegas Golden Knights and the Florida Panthers stood at 1.3 in the United States. This marked a 43 percent decrease on the ratings from a year earlier.
National Hockey League Stanley Cup games average TV ratings in the U.S. from 2006 to 2023
Profit from the additional features of your individual account
Currently, you are using a shared account. To use individual functions (e.g., mark statistics as favourites, set
statistic alerts) please log in with your personal account.
If you are an admin, please authenticate by logging in again.
Learn more about how Statista can support your business.
Sports Media Watch. (June 13, 2023). National Hockey League Stanley Cup games average TV ratings in the U.S. from 2006 to 2023 [Graph]. In Statista. Retrieved July 27, 2024, from https://www.statista.com/statistics/305818/average-tv-ratings-nhl-stanley-cup-games/
Sports Media Watch. "National Hockey League Stanley Cup games average TV ratings in the U.S. from 2006 to 2023." Chart. June 13, 2023. Statista. Accessed July 27, 2024. https://www.statista.com/statistics/305818/average-tv-ratings-nhl-stanley-cup-games/
Sports Media Watch. (2023). National Hockey League Stanley Cup games average TV ratings in the U.S. from 2006 to 2023. Statista. Statista Inc.. Accessed: July 27, 2024. https://www.statista.com/statistics/305818/average-tv-ratings-nhl-stanley-cup-games/
Sports Media Watch. "National Hockey League Stanley Cup Games Average Tv Ratings in The U.S. from 2006 to 2023." Statista, Statista Inc., 13 Jun 2023, https://www.statista.com/statistics/305818/average-tv-ratings-nhl-stanley-cup-games/
Sports Media Watch, National Hockey League Stanley Cup games average TV ratings in the U.S. from 2006 to 2023 Statista, https://www.statista.com/statistics/305818/average-tv-ratings-nhl-stanley-cup-games/ (last visited July 27, 2024)
National Hockey League Stanley Cup games average TV ratings in the U.S. from 2006 to 2023 [Graph], Sports Media Watch, June 13, 2023. [Online]. Available: https://www.statista.com/statistics/305818/average-tv-ratings-nhl-stanley-cup-games/