


Percentage of U.S. households, by type 1990-2022
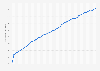
This statistic shows the distribution of households in the United States from 1990 to 2022, by type. In 2022, about 35.77 percent of all households in the United States were one person households.


