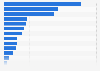
This statistic presents the share of overnight trips in Northern Ireland from 2014 to 2017, by country of origin. Around half of tourists on overnight trips in Northern Ireland are domestic tourists, while 29 percent come from Great Britain.
Share of overnight trips in Northern Ireland from 2014 to 2017, by place of origin
Basic Account
Get to know the platform
You only have access to basic statistics.
This statistic is not included in your account.
Starter Account
The ideal entry-level account for individual users
- Instant access to 1m statistics
- Download in XLS, PDF & PNG format
- Detailed references
$199 USD / Month *
Professional Account
Full access
Business Solutions including all features.
* Prices do not include sales tax.
Other statistics that may interest you Statistics on
About the industry
10
- Premium Statistic Inbound overnight tourism in Luxembourg 2008-2019
- Premium Statistic Inbound tourism expenditure in Northern Ireland 2011-2019
- Premium Statistic Leading inbound travel markets in winter in Austria 2019-2023, by overnight stays
- Premium Statistic Leading inbound travel markets in Malta 2019-2023, by number of nights
- Premium Statistic Leading inbound travel markets in summer in Austria 2020-2023, by overnight stays
- Premium Statistic Number of outbound overnight trips in Latvia 2012-2022
- Premium Statistic Key figures for tourism in Munich in 2021
- Premium Statistic Tourist overnight stays in Denmark 2019-2021, by month
- Basic Statistic Change in spend on visits from Poland to the UK 2004-2019
- Basic Statistic Change in spend on visits from Australia to the UK 2004-2019
About the region
10
- Premium Statistic Number of overnight trips to Northern Ireland 2011-2019
- Premium Statistic Tourism expenditure in Northern Ireland 2011-2019
- Premium Statistic Number of overnight stays in Northern Ireland 2011-2018
- Premium Statistic Number of domestic trips in Northern Ireland 2011-2019
- Premium Statistic Number of inbound trips to Northern Ireland 2011-2018
- Premium Statistic Domestic tourism expenditure in Northern Ireland 2011-2019
- Premium Statistic Inbound travel to Northern Ireland 2019, by country of origin
- Premium Statistic Inbound visitor overnight stays in Northern Ireland 2018, by accommodation type
- Premium Statistic Nights spent by visitors from Great Britain in Northern Ireland 2018
- Premium Statistic Overnight trips by British visitors to Northern Ireland 2018, by purpose
Selected statistics
8
- Premium Statistic Countries with the highest number of inbound tourist arrivals worldwide 2019-2022
- Premium Statistic Countries with the highest outbound tourism expenditure worldwide 2019-2022
- Premium Statistic International tourist arrivals in Europe 2006-2023
- Basic Statistic International tourism receipts of India 2011-2022
- Premium Statistic Annual revenue of China Tourism Group Duty Free 2013-2023
- Basic Statistic Foreign exchange earnings from tourism in India 2000-2022
- Premium Statistic Leading countries in the MEA in the Travel & Tourism Competitiveness Index 2018
- Premium Statistic Change in number of visitors from Mexico to the U.S. 2018-2024
Other regions
10
- Basic Statistic COVID-19 impact on overnight stays of foreign and domestic tourists in Finland 2022
- Premium Statistic Number of outbound trips from Spain 2018, by mode of transport
- Premium Statistic Accommodation establishments in Germany in 2020, by state
- Premium Statistic Share of international and domestic trips taken from Poland 2008 to 2017
- Premium Statistic Number of outbound trips from Switzerland by mode of transport 2017
- Premium Statistic Number of outbound trips from Lithuania 2022, by mode of transport
- Premium Statistic Number of outbound trips from Bulgaria 2018, by mode of transport
- Premium Statistic Number of outbound trips from the United Kingdom (UK) by mode of transport 2013
- Premium Statistic Number of outbound trips from Romania 2017, by mode of transport
- Premium Statistic Number of outbound trips from Slovenia 2018, by mode of transport
Related statistics
10
- Basic Statistic Leading inbound travel markets in Italy 2018, by arrivals
- Premium Statistic Inbound visits from the Netherlands to the United Kingdom (UK) 2019, by purpose
- Premium Statistic Average spending per visit of tourists from Spain in the UK 2004-2019
- Premium Statistic Average spending per visit of tourists from Portugal in the UK 2004-2019
- Premium Statistic Spending on visits from France in the UK 2004-2019
- Premium Statistic Average spending per visit of tourists from the Netherlands in the UK 2004-2019
- Premium Statistic Average spending per visit of tourists from India in the UK 2004-2019
- Premium Statistic Average spending per visit of tourists from Italy in the UK 2004-2019
- Premium Statistic Average spending per visit of tourists from Poland in the UK 2004-2019
- Premium Statistic Average spending per visit of tourists from Belgium in the UK 2004-2019
Further related statistics
10
- Net income of Tripadvisor worldwide 2008-2023
- Operating income of Tripadvisor worldwide 2008-2023
- Contribution of China's travel and tourism industry to GDP 2014-2023
- Middle Eastern countries with the largest international tourism receipts 2018
- Quarterly average daily rate of hotels in Houston 2016-2017
- Quarterly average daily rate of hotels in Brussels 2010-2017
- Quarterly average daily rate of hotels in Indianapolis 2016-2017
- Quarterly average daily rate of hotels in New York 2016-2017
- Quarterly average daily rate of hotels in Philadelphia 2016-2017
- Quarterly average daily rate of hotels in Portland 2016-2017
Further Content: You might find this interesting as well
Statistics
- Net income of Tripadvisor worldwide 2008-2023
- Operating income of Tripadvisor worldwide 2008-2023
- Contribution of China's travel and tourism industry to GDP 2014-2023
- Middle Eastern countries with the largest international tourism receipts 2018
- Quarterly average daily rate of hotels in Houston 2016-2017
- Quarterly average daily rate of hotels in Brussels 2010-2017
- Quarterly average daily rate of hotels in Indianapolis 2016-2017
- Quarterly average daily rate of hotels in New York 2016-2017
- Quarterly average daily rate of hotels in Philadelphia 2016-2017
- Quarterly average daily rate of hotels in Portland 2016-2017
Department of Enterprise, Trade and Investment (Northern Ireland). (June 7, 2018). Share of overnight trips in Northern Ireland from 2014 to 2017, by place of origin [Graph]. In Statista. Retrieved April 26, 2024, from https://www.statista.com/statistics/434483/overnight-trips-in-northern-irelan-by-place-of-origin/
Department of Enterprise, Trade and Investment (Northern Ireland). "Share of overnight trips in Northern Ireland from 2014 to 2017, by place of origin." Chart. June 7, 2018. Statista. Accessed April 26, 2024. https://www.statista.com/statistics/434483/overnight-trips-in-northern-irelan-by-place-of-origin/
Department of Enterprise, Trade and Investment (Northern Ireland). (2018). Share of overnight trips in Northern Ireland from 2014 to 2017, by place of origin. Statista. Statista Inc.. Accessed: April 26, 2024. https://www.statista.com/statistics/434483/overnight-trips-in-northern-irelan-by-place-of-origin/
Department of Enterprise, Trade and Investment (Northern Ireland). "Share of Overnight Trips in Northern Ireland from 2014 to 2017, by Place of Origin." Statista, Statista Inc., 7 Jun 2018, https://www.statista.com/statistics/434483/overnight-trips-in-northern-irelan-by-place-of-origin/
Department of Enterprise, Trade and Investment (Northern Ireland), Share of overnight trips in Northern Ireland from 2014 to 2017, by place of origin Statista, https://www.statista.com/statistics/434483/overnight-trips-in-northern-irelan-by-place-of-origin/ (last visited April 26, 2024)
Share of overnight trips in Northern Ireland from 2014 to 2017, by place of origin [Graph], Department of Enterprise, Trade and Investment (Northern Ireland), June 7, 2018. [Online]. Available: https://www.statista.com/statistics/434483/overnight-trips-in-northern-irelan-by-place-of-origin/