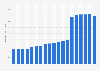
This statistic presents the net income of Euro Disney in France between 2013 and 2016. In 2014, net income group share was negative, at around - 94 million euros.
Euro Disney's net income worldwide between 2013 and 2016 (in millions euros)
Basic Account
Get to know the platform
You only have access to basic statistics.
This statistic is not included in your account.
Starter Account
The ideal entry-level account for individual users
- Instant access to 1m statistics
- Download in XLS, PDF & PNG format
- Detailed references
$199 USD / Month *
Professional Account
Full access
Business Solutions including all features.
* Prices do not include sales tax.
Other statistics that may interest you Statistics on
About the industry
10
- Premium Statistic Number of Euro Disney hires in France 2013-2016, by company
- Premium Statistic Number of Euro Disney group employees in France 2013-2016
- Premium Statistic Share of Euro Disney group employees by seniority in France 2013-2016
- Premium Statistic Share of Euro Disney employees in France 2013-2016, by age
- Premium Statistic Revenue from Euro Disney's tourist activities in France 2012-2016
- Premium Statistic Marketing expenses and revenue of Euro Disney in France 2012-2016
- Premium Statistic Ranking of sport, amusement, and recreation companies in Norway 2022, by turnover
- Premium Statistic Monthly variation of the hospitality economic activity in Argentina 2019-2021
- Premium Statistic Share of franchise industry in Germany 2021, by sector
- Premium Statistic Ranking of sport, amusement, and recreation companies in Sweden 2020, by turnover
About the region
9
- Premium Statistic Ranking of hotel groups according to the number of rooms in France 2016
- Premium Statistic Revenue of hotels and Disney Village in Disneyland Paris 2012-2016
- Premium Statistic Number of visitors to Disneyland Paris theme park in France 2009-2022
- Premium Statistic Disneyland Paris Walt Disney Studios Park theme park attendance in France 2010-2022
- Premium Statistic Cinema: distribution of the public by gender and type in France 2021
- Premium Statistic Total cinema screen closures in France 2006-2022
- Premium Statistic Total number of cinema seats in France 2009-2022
- Premium Statistic Total new cinema screens in France 2006-2022
- Premium Statistic Total active cinema screens in France 2009-2022
Selected statistics
1
Other regions
9
- Basic Statistic Most instagrammed tourist attractions worldwide 2018
- Premium Statistic RevPAR of Nordic Choice Hotels 2010-2019
- Premium Statistic Revenue per available room of Thon Hotels 2012-2019
- Premium Statistic Average RevPAR of Scandic hotels 2013-2019
- Premium Statistic OLC' operating income FY 2013-2022
- Basic Statistic Accommodation establishments declared essential by the Government in Spain March 2020
- Premium Statistic Central America: number of hotels by rating 2017
- Basic Statistic Central America: number of 3- to 5-star hotels 2017
- Premium Statistic Hotel brand competitiveness index in South Korea 2023
Related statistics
10
- Basic Statistic Amusement attractions brand equity ranking 2012
- Premium Statistic Domestic trips in Italy 2019-2022, by accommodation type
- Premium Statistic Impact of COVID-19 on hotel industry's employment in Italy 2020-2021
- Premium Statistic Number of accommodations in Brussels-Capital Region 2020, by type
- Premium Statistic Revenue of the hospitality industry in the Netherlands 2016-20120by type
- Premium Statistic Revenue of the hospitality industry in the Netherlands 2008-2020
- Premium Statistic Number of hotel overnight stays in Rome 2012-2022
- Premium Statistic Average stay in hotels of the Italian city of Rome 2012-2019
- Premium Statistic Average length of stay in tourist accommodations in Rome 2013-2019
- Premium Statistic Attendance at the Heineken Experience in the Netherlands 2011-2020
Further related statistics
10
- Operating income of the InterContinental Hotels Group 2007-2023
- Total assets of the InterContinental Hotels Group 2007-2023
- Income of the InterContinental Hotels Group 2007-2023
- Revenue of the InterContinental Hotels Group 2008-2023, by ownership type
- Number of employees of the InterContinental Hotel Group 2023
- Revenue of the InterContinental Hotels Group 2007-2023
- Number of Crowne Plaza hotels worldwide 2008-2023
- Number of Candlewood Suites hotel rooms worldwide 2008-2023
- Revenue of Marriott International worldwide 1999-2023
- Global occupancy rate of Marriott International hotels 2010-2023, by region
Further Content: You might find this interesting as well
Statistics
- Operating income of the InterContinental Hotels Group 2007-2023
- Total assets of the InterContinental Hotels Group 2007-2023
- Income of the InterContinental Hotels Group 2007-2023
- Revenue of the InterContinental Hotels Group 2008-2023, by ownership type
- Number of employees of the InterContinental Hotel Group 2023
- Revenue of the InterContinental Hotels Group 2007-2023
- Number of Crowne Plaza hotels worldwide 2008-2023
- Number of Candlewood Suites hotel rooms worldwide 2008-2023
- Revenue of Marriott International worldwide 1999-2023
- Global occupancy rate of Marriott International hotels 2010-2023, by region
Euro Disney, & AMF. (February 17, 2017). Euro Disney's net income worldwide between 2013 and 2016 (in millions euros) [Graph]. In Statista. Retrieved April 26, 2024, from https://www.statista.com/statistics/766374/euro-disney-result-net-share-of-group-worldwide/
Euro Disney, und AMF. "Euro Disney's net income worldwide between 2013 and 2016 (in millions euros)." Chart. February 17, 2017. Statista. Accessed April 26, 2024. https://www.statista.com/statistics/766374/euro-disney-result-net-share-of-group-worldwide/
Euro Disney, AMF. (2017). Euro Disney's net income worldwide between 2013 and 2016 (in millions euros). Statista. Statista Inc.. Accessed: April 26, 2024. https://www.statista.com/statistics/766374/euro-disney-result-net-share-of-group-worldwide/
Euro Disney, and AMF. "Euro Disney's Net Income Worldwide between 2013 and 2016 (in Millions Euros)." Statista, Statista Inc., 17 Feb 2017, https://www.statista.com/statistics/766374/euro-disney-result-net-share-of-group-worldwide/
Euro Disney & AMF, Euro Disney's net income worldwide between 2013 and 2016 (in millions euros) Statista, https://www.statista.com/statistics/766374/euro-disney-result-net-share-of-group-worldwide/ (last visited April 26, 2024)
Euro Disney's net income worldwide between 2013 and 2016 (in millions euros) [Graph], Euro Disney, & AMF, February 17, 2017. [Online]. Available: https://www.statista.com/statistics/766374/euro-disney-result-net-share-of-group-worldwide/