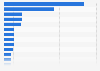
This statistic shows the average number of flight hours per aircraft flown by business aircraft worldwide from 2015 to 2020, broken down by aircraft type and quarter. In the third quarter of 2020, helicopters reported an average of 18.2 hours per aircraft.
Average flight hours per aircraft flown by business aircraft worldwide from 2015 to 2020, by quarter and aircraft type
Profit from the additional features of your individual account
Currently, you are using a shared account. To use individual functions (e.g., mark statistics as favourites, set
statistic alerts) please log in with your personal account.
If you are an admin, please authenticate by logging in again.
Learn more about how Statista can support your business.
JSSI. (October 29, 2020). Average flight hours per aircraft flown by business aircraft worldwide from 2015 to 2020, by quarter and aircraft type [Graph]. In Statista. Retrieved July 27, 2024, from https://www.statista.com/statistics/829339/average-flight-hours-worldwide-by-aircraft-type-business-aircraft/
JSSI. "Average flight hours per aircraft flown by business aircraft worldwide from 2015 to 2020, by quarter and aircraft type." Chart. October 29, 2020. Statista. Accessed July 27, 2024. https://www.statista.com/statistics/829339/average-flight-hours-worldwide-by-aircraft-type-business-aircraft/
JSSI. (2020). Average flight hours per aircraft flown by business aircraft worldwide from 2015 to 2020, by quarter and aircraft type. Statista. Statista Inc.. Accessed: July 27, 2024. https://www.statista.com/statistics/829339/average-flight-hours-worldwide-by-aircraft-type-business-aircraft/
JSSI. "Average Flight Hours per Aircraft Flown by Business Aircraft Worldwide from 2015 to 2020, by Quarter and Aircraft Type." Statista, Statista Inc., 29 Oct 2020, https://www.statista.com/statistics/829339/average-flight-hours-worldwide-by-aircraft-type-business-aircraft/
JSSI, Average flight hours per aircraft flown by business aircraft worldwide from 2015 to 2020, by quarter and aircraft type Statista, https://www.statista.com/statistics/829339/average-flight-hours-worldwide-by-aircraft-type-business-aircraft/ (last visited July 27, 2024)
Average flight hours per aircraft flown by business aircraft worldwide from 2015 to 2020, by quarter and aircraft type [Graph], JSSI, October 29, 2020. [Online]. Available: https://www.statista.com/statistics/829339/average-flight-hours-worldwide-by-aircraft-type-business-aircraft/