India’s roads have been filling up with taxis over the last decade as its ride-hailing market gets more and more accessible. But on these ride-hailing roads, it seems there is no coming between the two giants - Ola and Uber.
Ola has the home advantage over its U.S. counterpart. Established in 2011, Ola has a wider geographical network than Uber. With a presence in 110 cities, the Ola app probably has a higher reach because of its provisions for a handful of regional languages. The tailor-made needs of allowing cash payment and providing different economic classes of cabs as well as auto-rickshaws gives Ola the edge. Since 2016, it has also overcome India’s unstable data connectivity by allowing bookings via text messages.
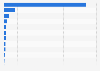
According to figures from Kalagato (reported by Quartz), the Bangalore-based company currently enjoys a market share of 56.2 percent. Now, it is reaching for a share of the global market, with plans to expand to Sri Lanka, Nepal, Bangladesh and Australia.
India
Ola at full throttle in India's ride-hailing market


Description
This chart shows the share of the ride hailing market in India as of December 2017, by company.