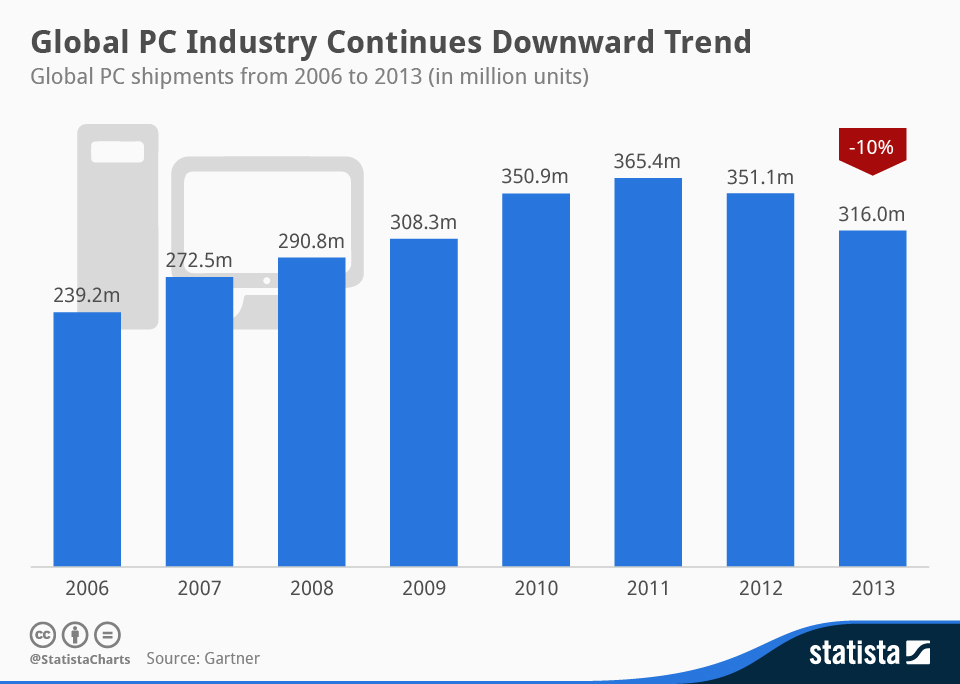
The global PC industry did not finish 2013 on a positive note. PC shipments declined 6.9 percent in the holiday quarter, ending a horrible year for the industry. As developed markets show strong signs of saturation and consumers in developing countries prefer lower cost alternatives such as tablets or smartphones PC sales suffered the biggest year-over-year decline (-10%) since Gartner started tracking the PC industry in the late 1980s. In the past 12 months, 316 million PCs were shipped globally, signifiyng the lowest level since 2009. Gartner belives that the industry has bottomed out and expects no further decline in 2014. Given the lack of innovation in the PC industry and the increasing competitiveness of tablets in terms of performance, we wouldn't bet on the PC industry though.
Advertisement
Advertisement
Advertisement
Related Infographics
FAQ
- The Statista "Chart of the Day", made available under the Creative Commons License CC BY-ND 3.0, may be used and displayed without charge by all commercial and non-commercial websites. Use is, however, only permitted with proper attribution to Statista. When publishing one of these graphics, please include a backlink to the respective infographic URL. More Information
- The Statista "Chart of the Day" currently focuses on two sectors: "Media and Technology", updated daily and featuring the latest statistics from the media, internet, telecommunications and consumer electronics industries; and "Economy and Society", which current data from the United States and around the world relating to economic and political issues as well as sports and entertainment.
- For individual content and infographics in your Corporate Design, please visit our agency website www.statista.design
Any more questions?
Get in touch with us quickly and easily.
We are happy to help!
Do you still have questions?
Feel free to contact us anytime using our contact form or visit our FAQ page.
Your contact to the Infographics Newsroom


Statista Content & Design
Need infographics, animated videos, presentations, data research or social media charts?
Advertisement