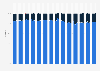
Most phone scams in 2014, 2019 nd 2020 targeted mobile phones in the United States. 82 percent of Americans who received scam calls in 2020 were contacted via their mobile phone and 28 percent were contacted via their landline.
Share of scam calls by type of phone line in the United States from 2014 to 2020
Profit from the additional features of your individual account
Currently, you are using a shared account. To use individual functions (e.g., mark statistics as favourites, set
statistic alerts) please log in with your personal account.
If you are an admin, please authenticate by logging in again.
Learn more about how Statista can support your business.
Truecaller. (April 16, 2020). Share of scam calls by type of phone line in the United States from 2014 to 2020 [Graph]. In Statista. Retrieved September 19, 2024, from https://www.statista.com/statistics/1050074/scam-calls-on-mobile-and-landline-in-the-us/
Truecaller. "Share of scam calls by type of phone line in the United States from 2014 to 2020." Chart. April 16, 2020. Statista. Accessed September 19, 2024. https://www.statista.com/statistics/1050074/scam-calls-on-mobile-and-landline-in-the-us/
Truecaller. (2020). Share of scam calls by type of phone line in the United States from 2014 to 2020. Statista. Statista Inc.. Accessed: September 19, 2024. https://www.statista.com/statistics/1050074/scam-calls-on-mobile-and-landline-in-the-us/
Truecaller. "Share of Scam Calls by Type of Phone Line in The United States from 2014 to 2020." Statista, Statista Inc., 16 Apr 2020, https://www.statista.com/statistics/1050074/scam-calls-on-mobile-and-landline-in-the-us/
Truecaller, Share of scam calls by type of phone line in the United States from 2014 to 2020 Statista, https://www.statista.com/statistics/1050074/scam-calls-on-mobile-and-landline-in-the-us/ (last visited September 19, 2024)
Share of scam calls by type of phone line in the United States from 2014 to 2020 [Graph], Truecaller, April 16, 2020. [Online]. Available: https://www.statista.com/statistics/1050074/scam-calls-on-mobile-and-landline-in-the-us/