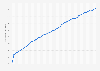
- Finance, Insurance & Real Estate›
- Banks & Financial Services›
U.S. household liabilities - trade payables 2012
Industry-specific and extensively researched technical data (partially from exclusive partnerships).
A paid subscription is required for full access.
U.S. household liabilities - trade payables 2012
Total trade payables liabilities of U.S. households and nonprofit organizations from 1990 to 2012 (in billion U.S. dollars)

Total trade payables liabilities of U.S. households and nonprofit organizations from 1990 to 2012 (in billion U.S. dollars)
Year | Liabilities in billion U.S. dollars |
---|---|
- | - |
- | - |
- | - |
- | - |
- | - |
- | - |
- | - |
- | - |
- | - |
Year | Liabilities in billion U.S. dollars |
---|---|
- | - |
- | - |
- | - |
- | - |
- | - |
- | - |
- | - |
- | - |
- | - |
You need a Premium Account for unlimited access.
Full access to 1m statistics
Incl. source references
Available to download in PNG, PDF, XLS format
You need a Premium Account for unlimited access.
Full access to 1m statistics
Incl. source references
Available to download in PNG, PDF, XLS format
© Statista 2019
About this statistic
Show source
Please be patient - this may take a moment
Description
Source
More information
- Show sources information
- Show publisher information
- Release date
- December 2013
- Region
- United States
- Survey time period
- 1990 to 2012
- Supplementary notes
- The statistic from 2011 has been taken from the printed edition of the Statistical Abstract of the United States 2013, page 757, table 1183. Some of the figure for previous years may also vary, this is due to the revised figures appearing in the newest Statistical Abstract publication.
Source
- Show sources information
- Show publisher information
- Release date
- December 2013
More information
- Region
- United States
- Survey time period
- 1990 to 2012
- Supplementary notes
- The statistic from 2011 has been taken from the printed edition of the Statistical Abstract of the United States 2013, page 757, table 1183. Some of the figure for previous years may also vary, this is due to the revised figures appearing in the newest Statistical Abstract publication.
You only have access to basic statistics.
This statistic is not included in your account!
- Instant access to 1m statistics
- Download in XLS, PDF & PNG format
- Detailed references
$59 / Month *
Corporate solution including all features.
Prices do not include sales tax.


I think of Statista as Google for researchers. Statista provides you with the information you search for right away.Dr. Horst Stipp
EVP, Research & Innovation, Advertising Research Foundation
- Households and families
- Number of households in the United States in 2019, by type (in millions)Number of U.S. households, by type 2019
- Percentage of households in the U.S. from 1990 to 2019, by typePercentage of U.S. households, by type 1990-2019
- Number of households in the U.S. from 1960 to 2019 (in millions)Number of households in the U.S. 1960-2019
- Average number of people per household in the United States from 1960 to 2019Average size of households in the U.S. 1960-2019
- Number of households in the United States in 2018, by state (in millions)Number of U.S. households, by state 2018
- Average size of households in the United States in 2018, by stateAverage size of U.S. households, by state 2018
- Number of households in the United States from 1970 to 2019, by size of household (in millions)Number of households in the U.S. by size of household 1970-2019
- Distribution of households in the United States from 1970 to 2019, by household sizeDistribution of households in the U.S., by household size 1970-2019
- Marriage and divorce
- Marital status of the U.S. population in 2019, by sex (in millions)Marital status of the U.S. population, by sex 2019
- Number of marriages in the United States from 1990 to 2017 (in millions)Number of marriages in the U.S. 1990-2017
- Number of divorces in the United States from 1981 to 2017 (in millions)Number of divorces in the U.S. 1981-2017
- Marriage rate in the United States from 1990 to 2017 (per 1,000 of population)USA - Marriage rate 1990-2017
- Divorce rate in the United States from 1990 to 2017 (per 1,000 of population)U.S. - divorce rate 1990-2017
- Marriage rates in the United States in 2017, by stateMarriage rates in the U.S. 2017, by state
- Divorce rate in the United States in 2017, by state (per 1,000 of population)U.S. - divorce rate by state 2017
- Number of married couples in the United States in 2019, by ethnic group and origin of spouses (in 1,000s)Interracially married couples, by race and Hispanic origin U.S. 2019
- U.S. household liabilities: security credits
- U.S. households and NPOs liabilities in commercial mortgages 2000-2017
- Value of online credit outstanding in China 2013-2020
- Year-on-year change of online credit outstanding in China 2014-2020
- Value of consumer credit outstanding in the U.S. 2000-2018
- Total consumer credit outstanding in the United States 2017-2018
- Year-on-year change of internet asset management in China 2014-2020
- Size of internet asset management market in China 2013-2020
- U.S. houshold and NPO credit market instrument liabilities 2000-2014
- Total debt securities of U.S. agency- and GSE-backed mortgage pools sector 2000-2017
- Total debt securities of U.S. funding corporation sector 2000-2017
- U.S. credit market debt: nonfarm noncorporate business sector
- Credit market debt in the U.S. in life insurance sector 2000-2014
- Total debt securities of U.S. nonfinancial corporate business sector 2017
- Total debt securities of the U.S. real estate investment trusts 2000-2017
- Credit market debt of the U.S. credit union sector 2000-2014
- Liabilities of households in the Benelux in short-term loans 2013-2019, by country
- Total debt securities of the U.S. financial brokers and dealers 2000-2017
- U.S. credit market debt: savings institution sector
- Total debt securities of the U.S. GSE sector 2000-2017
- Number of U.S. households, by type 2019
- Percentage of U.S. households, by type 1990-2019
- Number of households in the U.S. 1960-2019
- Average size of households in the U.S. 1960-2019
- Number of U.S. households, by state 2018
- Average size of U.S. households, by state 2018
- Number of households in the U.S. by size of household 1970-2019
- Distribution of households in the U.S., by household size 1970-2019
- Number of households by household income in the U.S. 2018
- Number of households, by ethnic group U.S. 2019
- Number of families in the U.S. 1960-2019
- Average size of a family in the US 1960-2019
- Average size of U.S. families, by state 2018
- U.S. family households with children, by family type 1970-2019
- Number of families in the US by number of children 2000-2019
- Family income levels in the U.S. - percentage distribution 2018
- U.S. families: income distribution by race and origin in 2018
- Number of married couples in the U.S. 1960-2019
- Share of married couple households with children in the U.S. 2018, by state
- United States - number of families with a single father 1990-2018
- Number of families with a single mother in the U.S. 1990-2018
- Percentage of single mother households in the U.S. 2018, by state
- Number of single-person households in the U.S. 1960-2019
- Percentage of single-person households, by state U.S. 2018
- U.S. cities with the largest percentage of one-person households 2018
- Marital status of the U.S. population, by sex 2019
- Number of marriages in the U.S. 1990-2017
- Number of divorces in the U.S. 1981-2017
- USA - Marriage rate 1990-2017
- U.S. - divorce rate 1990-2017
- Marriage rates in the U.S. 2017, by state
- U.S. - divorce rate by state 2017
- Interracially married couples, by race and Hispanic origin U.S. 2019
- Median age of U.S. Americans at their first wedding 1998-2018, by sex
- Median age of U.S. Americans at their first wedding 2018, by race and origin
- U.S. household liabilities: security credits
- U.S. households and NPOs liabilities in commercial mortgages 2000-2017
- Value of online credit outstanding in China 2013-2020
- Year-on-year change of online credit outstanding in China 2014-2020
- Value of consumer credit outstanding in the U.S. 2000-2018
- Total consumer credit outstanding in the United States 2017-2018
- Year-on-year change of internet asset management in China 2014-2020
- Size of internet asset management market in China 2013-2020
- U.S. houshold and NPO credit market instrument liabilities 2000-2014
- Total debt securities of U.S. agency- and GSE-backed mortgage pools sector 2000-2017
- Total debt securities of U.S. funding corporation sector 2000-2017
- U.S. credit market debt: nonfarm noncorporate business sector
- Credit market debt in the U.S. in life insurance sector 2000-2014
- Total debt securities of U.S. nonfinancial corporate business sector 2017
- Total debt securities of the U.S. real estate investment trusts 2000-2017
- Credit market debt of the U.S. credit union sector 2000-2014
- Liabilities of households in the Benelux in short-term loans 2013-2019, by country
- Total debt securities of the U.S. financial brokers and dealers 2000-2017
- U.S. credit market debt: savings institution sector
- Total debt securities of the U.S. GSE sector 2000-2017
Statista offers dossiers and reports on over 170 industries. With Statista you are always able to make informed decisions and boost your work efficiency.
- Social Media
- E-Commerce
- Online Video & Entertainment
- Advertising & Marketing
- Alcoholic Beverages
- Cleaning Products
- Cosmetics & Personal Care
- Food & Nutrition
- Health & Hygiene
- International Trade
- Shopping Behavior
- Sports & Leisure
- Business Travel
- Leisure Travel
- Accomodation
- Restaurants
- Demographics
- Economy
- Education & Science
- Politics & Government
- Aviation
- Rail Transport
- Vehicles & Road Traffic
- Water Transport
You can only download this statistic as a Premium user.
As a Premium user you get access to the detailed source references and background information about this statistic.
As a Premium user you get access to background information and details about the release of this statistic.
As soon as this statistic is updated, you will immediately be notified via e-mail.
...and make my research life easier.
You need at least a Premium Account to use this feature.
This feature is limited to our corporate solutions.
Please contact us to get started with full access to dossiers, forecasts, studies and international data.
We use cookies to personalize contents and ads, offer social media features, and analyze access to our website. In your browser settings you can configure or disable this, respectively, and can delete any already placed cookies. For details, please see your browser’s Help section (by pressing F1). Please see our privacy statement for details about how we use data.