
Fernando de Querol Cumbrera
Research expert covering construction, loans, leasing, savings, and debt
Get in touch with us now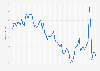
Detailed statistics
Personal savings as a percentage of disposable income in the U.S. 1960-2023

Detailed statistics
Gross private savings in the U.S. 1960-2022

Detailed statistics
Personal savings in the U.S. 1960-2023

Monthly personal savings as a share of disposable income in the U.S. 2015-2024
Personal savings as a percentage of disposable income in the United States from June 2015 to February 2024

Mean and median amount of personal savings in the U.S. 2022-2023, by type
Mean and median amount of personal savings in the United States from 2022 to 2023, by type (in U.S. dollars)
Personal savings in the U.S. 1960-2023
Value of personal savings in the United States from 1960 to 2023 (in billion U.S. dollars)

Savings and other checkable deposits in the U.S. 2020-2023
Value of savings deposits and other checkable deposits in the United States from May 2020 to December 2023 (in trillion U.S. dollars)

Amount of money saved in savings accounts in the U.S. 2023
Amount of money saved in savings accounts in the United States as of July 2023

Gross savings as share of GDP in the U.S. 1970-2021
Gross savings as share of gross domestic product (GDP) in the United States from 1970 to 2021

Household savings in the U.S. 2000-2022
Value of household savings in the United States from 2000 to 2022 (in billion U.S. dollars)

Time and savings deposits of households and nonprofit organizations U.S. 2000-2022
Value of assets held by households and nonprofit organizations in time and savings deposits in the United States from 2000 to 2022 (in trillion U.S. dollars)

Share of families that saved in the U.S. 2001-2022, by ethnicity
Percentage of households that saved in the United States in selected years from 2001 to 2022, by ethnicity

Share of families that saved in the U.S. 2004-2022, by work status
Share of households that saved money in the United States from 2004 to 2022, by work status of family head

Share of families with savings bonds in the U.S. 2007-2022, by age of family head
Share of households holding savings bonds in the United States from 2007 to 2022, by age of family head

Financial instruments owned by children in the U.S. 2022
Financial instruments and accounts owned by children in the United States 2022

Households saving for college in the U.S. 2020-2022, by age of household head
Share of households saving for college in the United States from 2020 to 2022, by age of head of household

Total Education tax savings for college students U.S. 2002-2023
Total Education tax savings for college students and their parents across the United States from 2002/2003 to 2022/2023 (in billion 2022 U.S. dollars)

Assets of section 529 savings plan in the U.S. 2009-2022
Assets of section 529 savings plan in the United States from 2009 to 2022 (in billion U.S. dollars)

529 college savings average account balance in the U.S. 2016-2022
Average balance of 529 college savings accounts in the United States from 2016 to 2022 (in U.S. dollars)

Adults with any retirement savings in the U.S. 2021-2022, by age group
Share of adults with any retirement savings in the United States from 2021 to 2022, by age group

Opinion of Americans on state of their retirement savings 2022, by ethnicity
Opinion on state of retirement savings in the United States in 2022, by ethnicity

Confidence in progress toward retirement goals for individuals in the U.S. 2023
Confidence in progress toward retirement goals for individuals in the United States in 2023, by respondent type

Household retirement savings in the U.S. 2020-2022, by amount
Household retirement savings in the United States from 2020 to 2022, by amount

Value of assets invested in IRAs in the U.S. 2022, by type
Value of assets invested in individual retirement accounts (IRAs) in the United States in 2022, by type (in trillion U.S. dollars)

Probability of outliving their savings in the U.S. 2020-2023
Probability of outliving savings in the United States from 2020 to 2023

Leading challenges of individuals saving for retirement in the U.S. 2023
Leading challenges of individuals saving for retirement in the United States in 2023, by respondent type

Reasons why families saved in the U.S. 2010-2022
Drivers for saving among families in the United States from 2010 to 2022

Goals in New Year's financial resolution in the U.S. 2022
Goals in New Year's financial resolution in the United States as of November 2022

Factors that are holding back Americans from saving for a down payment 2022
Factors that are holding back non-homeowners from saving for a down payment on a home purchase in the United States in 2022

Major obstacles to saving for a down payment among American homebuyers 2022, by age
Factors holding back homebuyers from saving for a down payment in the United States in 2022, by age group

Emergency bill: savings, credit card, borrow vs personal loan U.S. 2023
Share of people who would use selected methods to cover a 1,000 U.S. dollar emergency bill in the United States in December 2023

Bank account and service complaints reported CFPB in the U.S. 2023
Distribution of checking or savings complaints reported to Consumer Financial Protection Bureau in the United States in 2023

Interest rates of savings accounts in selected banks in the U.S. 2024
Annual percentage yield (APY) on savings accounts of selected banks and financial service providers in the United States as of March 2024

Main reasons why people did not increase emergency savings in the U.S. 2023
Main reasons why people could not increase their emergency savings in the United States as of September 2023

Actions people have found most effective to save money worldwide 2022
Actions that people have found most effective to cut costs as of September 2022, by type of action

Consumers' food cost saving behavior in the U.S. 2024
Consumers' food cost saving behavior in the United States as of February 2024


Mon - Fri, 9am - 6pm (EST)
Mon - Fri, 9am - 5pm (SGT)
Mon - Fri, 10:00am - 6:00pm (JST)
Mon - Fri, 9:30am - 5pm (GMT)
Mon - Fri, 9am - 6pm (EST)


