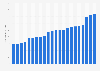
The average revenue multiple per franchise in Major League Baseball was calculated by dividing the total franchise values in the league by the total league revenues. In 2024, the average revenue multiple per MLB franchise was 6.36.
Major League Baseball average revenue multiple per team from 2005 to 2024
Profit from the additional features of your individual account
Currently, you are using a shared account. To use individual functions (e.g., mark statistics as favourites, set
statistic alerts) please log in with your personal account.
If you are an admin, please authenticate by logging in again.
Learn more about how Statista can support your business.
Forbes. (March 28, 2024). Major League Baseball average revenue multiple per team from 2005 to 2024 [Graph]. In Statista. Retrieved July 27, 2024, from https://www.statista.com/statistics/193501/mlb-franchises-average-revenue-multiple-since-2005/
Forbes. "Major League Baseball average revenue multiple per team from 2005 to 2024." Chart. March 28, 2024. Statista. Accessed July 27, 2024. https://www.statista.com/statistics/193501/mlb-franchises-average-revenue-multiple-since-2005/
Forbes. (2024). Major League Baseball average revenue multiple per team from 2005 to 2024. Statista. Statista Inc.. Accessed: July 27, 2024. https://www.statista.com/statistics/193501/mlb-franchises-average-revenue-multiple-since-2005/
Forbes. "Major League Baseball Average Revenue Multiple per Team from 2005 to 2024." Statista, Statista Inc., 28 Mar 2024, https://www.statista.com/statistics/193501/mlb-franchises-average-revenue-multiple-since-2005/
Forbes, Major League Baseball average revenue multiple per team from 2005 to 2024 Statista, https://www.statista.com/statistics/193501/mlb-franchises-average-revenue-multiple-since-2005/ (last visited July 27, 2024)
Major League Baseball average revenue multiple per team from 2005 to 2024 [Graph], Forbes, March 28, 2024. [Online]. Available: https://www.statista.com/statistics/193501/mlb-franchises-average-revenue-multiple-since-2005/