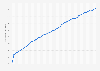
In 2022/23, the average household in the United Kingdom spent around 567.7 British pounds a week, compared with 588.8 pounds in 2020/21. During this time period, household spending peaked in 2018/19 at 697.1 pounds per week.
Average weekly household expenditure in the United Kingdom from 2001/02 to 2022/23
(in GBP)
Profit from the additional features of your individual account
Currently, you are using a shared account. To use individual functions (e.g., mark statistics as favourites, set
statistic alerts) please log in with your personal account.
If you are an admin, please authenticate by logging in again.
Learn more about how Statista can support your business.
Office for National Statistics (UK). (August 23, 2024). Average weekly household expenditure in the United Kingdom from 2001/02 to 2022/23 (in GBP) [Graph]. In Statista. Retrieved October 06, 2024, from https://www.statista.com/statistics/384360/household-expenditure-uk/
Office for National Statistics (UK). "Average weekly household expenditure in the United Kingdom from 2001/02 to 2022/23 (in GBP)." Chart. August 23, 2024. Statista. Accessed October 06, 2024. https://www.statista.com/statistics/384360/household-expenditure-uk/
Office for National Statistics (UK). (2024). Average weekly household expenditure in the United Kingdom from 2001/02 to 2022/23 (in GBP). Statista. Statista Inc.. Accessed: October 06, 2024. https://www.statista.com/statistics/384360/household-expenditure-uk/
Office for National Statistics (UK). "Average Weekly Household Expenditure in The United Kingdom from 2001/02 to 2022/23 (in Gbp)." Statista, Statista Inc., 23 Aug 2024, https://www.statista.com/statistics/384360/household-expenditure-uk/
Office for National Statistics (UK), Average weekly household expenditure in the United Kingdom from 2001/02 to 2022/23 (in GBP) Statista, https://www.statista.com/statistics/384360/household-expenditure-uk/ (last visited October 06, 2024)
Average weekly household expenditure in the United Kingdom from 2001/02 to 2022/23 (in GBP) [Graph], Office for National Statistics (UK), August 23, 2024. [Online]. Available: https://www.statista.com/statistics/384360/household-expenditure-uk/