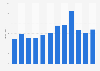
This statistic presents the turnover from the wholesale of furniture, carpets and lighting equipment in Iceland annually between 2008 and 2017. The wholesale trade for furniture, carpets and lighting equipment in Iceland generated revenues of approximately 4.2 billion Icelandic krónur in 2017.
Turnover of furniture, carpets and lighting equipment wholesale trade in Iceland from 2008 to 2018 (in million ISK)
Basic Account
Get to know the platform
You only have access to basic statistics.
This statistic is not included in your account.
Starter Account
The ideal entry-level account for individual users
- Instant access to 1m statistics
- Download in XLS, PDF & PNG format
- Detailed references
$59 USD $39 USD / Month *
in the first 12 months
Professional Account
Full access
Business Solutions including all features.
* Prices do not include sales tax.
Statistics on Furniture manufacturing industry in Italy
Market overview
6
- Premium Statistic Furniture manufacturing revenue monthly index in Italy 2019-2022
- Premium Statistic Consumer intending to buy furniture in the next three months in Italy 2019-2021
- Premium Statistic Most common offline purchases by type in Italy 2022
- Premium Statistic Turnover of the office and shop furniture industry in Italy 2010-2019
- Premium Statistic Turnover of the furniture industry in Italy 2019, by sector
- Premium Statistic Leading outdoor furniture manufacturer in Italy 2020, by revenue
Consumption & CPI
7
- Basic Statistic Monthly bedroom furniture consumer price index (CPI) in Italy 2018-2022
- Basic Statistic Monthly kitchen furniture consumer price index (CPI) in Italy 2018-2022
- Basic Statistic Monthly bathroom furniture consumer price index (CPI) in Italy 2018-2022
- Basic Statistic Monthly living room furniture consumer price index (CPI) in Italy 2018-2022
- Premium Statistic Variation of furniture and home furnishings' consumption value in Italy 2014-2020
- Premium Statistic Consumption expenditure on furniture and home furnishings in Italy 2014-2020
- Premium Statistic Change in non-food sector consumption value in Italy 2020, by category
Selected companies
4
- Premium Statistic Sales value of Italian furniture company Calligaris 2015-2020
- Premium Statistic Sales value of Italian furniture company Design Holding 2016-2020
- Premium Statistic Sales value of Italian furniture company Felofin SpA 2015-2020
- Premium Statistic Sales value of Italian furniture company Flexform 2015-2020
Furniture in Europe
5
- Basic Statistic Number of office and shop furniture manufacturers in the UK 2021, by turnover
- Premium Statistic Furniture: monthly producer price index (PPI) in the UK 2015-2022
- Premium Statistic Leading Spanish kitchen furniture manufacturers 2020
- Premium Statistic Furniture industry revenue in Belgium 2012-2021
- Premium Statistic Furniture manufacturing turnover in Norway 2010-2020
Further related statistics
13
- Employment in furniture, carpet & lighting equipment wholesalers in the UK 2008-2019
- Furniture market value in Switzerland 2006-2012
- Kitchen furniture production value in Austria 2008-2013
- Furniture industry revenue in Belgium 2012-2021
- Furniture industry: revenue growth rate in Belgium 2007-2021
- Monthly manufacturer sales of household & institutional furniture in Canada 2015-2021
- Furniture manufacturing: change in revenue in the Netherlands 2008-2021
- Furniture market value in Denmark 2011-2016
- Office furniture market value in Denmark 2011-2016
- Italy: import value of foreign furniture in 2009-2014
- Turnover of office furniture wholesale in Latvia 2008-2013
- Value of household furniture products exported from the U.S. 2017-2019
- Industry revenue of “furniture and related product manufacturing“ in New York 2012-2024
Further Content: You might find this interesting as well
Statistics
- Employment in furniture, carpet & lighting equipment wholesalers in the UK 2008-2019
- Furniture market value in Switzerland 2006-2012
- Kitchen furniture production value in Austria 2008-2013
- Furniture industry revenue in Belgium 2012-2021
- Furniture industry: revenue growth rate in Belgium 2007-2021
- Monthly manufacturer sales of household & institutional furniture in Canada 2015-2021
- Furniture manufacturing: change in revenue in the Netherlands 2008-2021
- Furniture market value in Denmark 2011-2016
- Office furniture market value in Denmark 2011-2016
- Italy: import value of foreign furniture in 2009-2014
- Turnover of office furniture wholesale in Latvia 2008-2013
- Value of household furniture products exported from the U.S. 2017-2019
- Industry revenue of “furniture and related product manufacturing“ in New York 2012-2024
Statistics Iceland. (June 9, 2019). Turnover of furniture, carpets and lighting equipment wholesale trade in Iceland from 2008 to 2018 (in million ISK) [Graph]. In Statista. Retrieved March 27, 2023, from https://www.statista.com/statistics/431958/furniture-carpets-wholesale-turnover-in-iceland/
Statistics Iceland. "Turnover of furniture, carpets and lighting equipment wholesale trade in Iceland from 2008 to 2018 (in million ISK)." Chart. June 9, 2019. Statista. Accessed March 27, 2023. https://www.statista.com/statistics/431958/furniture-carpets-wholesale-turnover-in-iceland/
Statistics Iceland. (2019). Turnover of furniture, carpets and lighting equipment wholesale trade in Iceland from 2008 to 2018 (in million ISK). Statista. Statista Inc.. Accessed: March 27, 2023. https://www.statista.com/statistics/431958/furniture-carpets-wholesale-turnover-in-iceland/
Statistics Iceland. "Turnover of Furniture, Carpets and Lighting Equipment Wholesale Trade in Iceland from 2008 to 2018 (in Million Isk)." Statista, Statista Inc., 9 Jun 2019, https://www.statista.com/statistics/431958/furniture-carpets-wholesale-turnover-in-iceland/
Statistics Iceland, Turnover of furniture, carpets and lighting equipment wholesale trade in Iceland from 2008 to 2018 (in million ISK) Statista, https://www.statista.com/statistics/431958/furniture-carpets-wholesale-turnover-in-iceland/ (last visited March 27, 2023)
Turnover of furniture, carpets and lighting equipment wholesale trade in Iceland from 2008 to 2018 (in million ISK) [Graph], Statistics Iceland, June 9, 2019. [Online]. Available: https://www.statista.com/statistics/431958/furniture-carpets-wholesale-turnover-in-iceland/