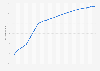
Per capita living space in urban Beijing 2008-2022

Per capita living space in urban areas of Beijing, China from 2008 to 2022

Download
Show detailed source information?
Register for free
Already a member?
Log in
Source

Use Ask Statista Research Service

Release date

November 2023

Region

China

Survey time period

2008 to 2022

Citation formats
Statista Accounts: Access All Statistics. Starting from $2,388 USD / Year
Basic Account
Get to know the platform

You only have access to basic statistics.
This statistic is not included in your account.

Starter Account
The ideal entry-level account for individual users
  • Instant access to 1m statistics
  • Download in XLS, PDF & PNG format
  • Detailed references
$199 USD / Month *
Professional Account
Full access

Business Solutions including all features.

* Prices do not include sales tax.

Statistics on " Social housing in China "

Other statistics that may interest you Social housing in China

Overview

7

Housing burden

6

Urban renewal and affordable housing purchases

7

Subsidized rental housing

4

Regional and international comparison

5

Further related statistics

14
Statista Accounts: Access All Statistics. Starting from $2,388 USD / Year
Learn more about how Statista can support your business.