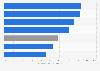
Monthly average income per capita in Da Nang Vietnam 2010-2022

Monthly average income per capita of Da Nang in Vietnam from 2010 to 2022

Download
Show detailed source information?
Register for free
Already a member?
Log in
Source

Use Ask Statista Research Service

Release date

June 2023

Region

Vietnam

Survey time period

2010 to 2022

Special properties

figures are at current prices

Supplementary notes

* Preliminary figures.

Figures have been rounded.

Figures prior to 2021 were from previous reporting.

One thousand Vietnamese dong equals 0.041 U.S. dollars and 0.039 euros as of September 2023.

Citation formats
Statista Accounts: Access All Statistics. Starting from $2,388 USD / Year
Basic Account
Get to know the platform

You only have access to basic statistics.
This statistic is not included in your account.

Starter Account
The ideal entry-level account for individual users
  • Instant access to 1m statistics
  • Download in XLS, PDF & PNG format
  • Detailed references
$199 USD / Month *
Professional Account
Full access

Business Solutions including all features.

* Prices do not include sales tax.

Statistics on " Urbanization in Vietnam "

Other statistics that may interest you Urbanization in Vietnam

Overview

3

Key demographic figures

7

Cities

7

Population density

7

Income

7

Consumption

7

Further related statistics

17
Statista Accounts: Access All Statistics. Starting from $2,388 USD / Year
Learn more about how Statista can support your business.