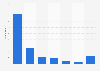
This statistic displays the share of public and private schhol teachers in the United States, who were threatened with injury by students during the previous 12 months in the school year 2007-08. 5 percent of elementary school teachers in suburban areas were threatened with injury.
Percentage of teachers who were threatened with injury by a student during the previous 12 months, in the School year 2007-08 by urbanicity and instructional level
Loading statistic...
Basic Account
Get to know the platform
You only have access to basic statistics.
Starter Account
The ideal entry-level account for individual users
- Instant access to 1m statistics
- Download in XLS, PDF & PNG format
- Detailed references
$149 USD / Month *
Professional Account
Full access
Business Solutions including all features.
* Prices do not include sales tax.
Other statistics that may interest you Statistics on
About the industry
10
- Basic Statistic Violence against teachers by students in U.S. schools in 2008
- Basic Statistic Public schools in the U.S. - share reporting incidents of crime 2020
- Basic Statistic U.S. school crime: student victims of injuries with weapons, by gender 2017
- Premium Statistic Schools in the U.S.: victims of threats/injuries by weapons, by ethnicity 2019
- Premium Statistic U.S. forcible rape/sexual assault victims 2022, by victim/offender relationship
- Premium Statistic U.S. forcible rape/sexual assault victims 2022, by weapon presence
- Premium Statistic Forcible rape and sexual assault victims in the U.S. 1993-2022, by sex
- Basic Statistic Homicides of youth ages 5-18 years in U.S. schools 1992-2020
- Basic Statistic Number of homicides and suicides of youth at schools U.S. 2020, by location
- Basic Statistic Number of reported crimes in Sweden 2022, by type
About the region
10
- Basic Statistic Public schools in the U.S. - crime rate in 2010
- Basic Statistic Murder in the U.S.: number of offenders 2022, by age
- Basic Statistic Number of murder offenders in the U.S. 2022, by gender
- Basic Statistic Number of justifiable homicides U.S. 2007-2022
- Basic Statistic Number of robberies in the U.S. 2022, by weapon
- Basic Statistic USA - reported murder and nonnegligent manslaughter rate 1990-2022
- Basic Statistic U.S.: reported murder and nonnegligent manslaughter cases 1990-2022
- Basic Statistic USA - arrest rate for violent offenses 1990-2022
- Basic Statistic Number of assaults U.S. 2022, by weapon used
- Basic Statistic USA - reported forcible rape rate 1990-2022
Selected statistics
1
Other regions
10
- Premium Statistic Aggravated assault case clearance rate of the police Germany 2011-2022
- Basic Statistic Number of sexual orientation hate crimes in England and Wales 2011-2023
- Premium Statistic Robbery rate in the Caribbean 2019, by country
- Basic Statistic Offences against the youth protection law in Belgium 2008-2022
- Basic Statistic Youth violent crime severity index in Canada 2000-2021
- Basic Statistic Homicide rate per 100,000 population in Finland 2010-2020, by gender
- Basic Statistic Prison population in Italy 2023, by crime type
- Basic Statistic 2012 United States Peace Index, by state
- Premium Statistic Number of religious hate crimes in England and Wales 2022, by religion of victim
- Premium Statistic El Salvador: number of homicides 2018, by department
Related statistics
10
- Basic Statistic USA - number of arrests for violent offenses 1990-2022
- Basic Statistic USA - reported robbery rate 1990-2022
- Basic Statistic U.S.: reported forcible rape cases 1990-2022
- Basic Statistic USA - reported property crime rate 1990-2022
- Basic Statistic U.S.: reported robbery cases 1990-2022
- Basic Statistic U.S.: reported cases of aggravated assault 1990-2022
- Basic Statistic Murder in the U.S.: number of victims in 2022, by race
- Basic Statistic Murder victims by weapon used in the U.S 2022
- Basic Statistic Homicide in the U.S. - number of victims 2022, by age
- Basic Statistic USA - reported aggravated assault rate 1990-2022
Further related statistics
10
- Number of arrests in the U.S. for federal property offenses 2014, by type
- U.S. capital punishment - average time elapsed since sentencing
- U.S. students who experienced teen dating violence 2021, by sex
- Deaths by motor vehicle-related injuries in the U.S. 1950-2019
- Number of internet users in Great Britain 2006-2020, by frequency
- U.S. students who watch at least three hours of TV a day 2017
- Obese high school students in the U.S. in 2016-2017, by gender and ethnicity
- Overweight high school students in the U.S. in 2016-2017, by gender and ethnicity
- Share of teachers in the U.S. 2012, by ethnicity and school type
- Share of teachers in the U.S. 2007/08, by base salary and school type
Further Content: You might find this interesting as well
Statistics
- Number of arrests in the U.S. for federal property offenses 2014, by type
- U.S. capital punishment - average time elapsed since sentencing
- U.S. students who experienced teen dating violence 2021, by sex
- Deaths by motor vehicle-related injuries in the U.S. 1950-2019
- Number of internet users in Great Britain 2006-2020, by frequency
- U.S. students who watch at least three hours of TV a day 2017
- Obese high school students in the U.S. in 2016-2017, by gender and ethnicity
- Overweight high school students in the U.S. in 2016-2017, by gender and ethnicity
- Share of teachers in the U.S. 2012, by ethnicity and school type
- Share of teachers in the U.S. 2007/08, by base salary and school type
US Department of Education, & US Bureau of Justice Statistics. (February 22, 2012). Percentage of teachers who were threatened with injury by a student during the previous 12 months, in the School year 2007-08 by urbanicity and instructional level [Graph]. In Statista. Retrieved November 28, 2023, from https://www.statista.com/statistics/183632/violence-against-teachers-by-students/
US Department of Education, und US Bureau of Justice Statistics. "Percentage of teachers who were threatened with injury by a student during the previous 12 months, in the School year 2007-08 by urbanicity and instructional level." Chart. February 22, 2012. Statista. Accessed November 28, 2023. https://www.statista.com/statistics/183632/violence-against-teachers-by-students/
US Department of Education, US Bureau of Justice Statistics. (2012). Percentage of teachers who were threatened with injury by a student during the previous 12 months, in the School year 2007-08 by urbanicity and instructional level. Statista. Statista Inc.. Accessed: November 28, 2023. https://www.statista.com/statistics/183632/violence-against-teachers-by-students/
US Department of Education, and US Bureau of Justice Statistics. "Percentage of Teachers Who Were Threatened with Injury by a Student during The Previous 12 Months, in The School Year 2007-08 by Urbanicity and Instructional Level." Statista, Statista Inc., 22 Feb 2012, https://www.statista.com/statistics/183632/violence-against-teachers-by-students/
US Department of Education & US Bureau of Justice Statistics, Percentage of teachers who were threatened with injury by a student during the previous 12 months, in the School year 2007-08 by urbanicity and instructional level Statista, https://www.statista.com/statistics/183632/violence-against-teachers-by-students/ (last visited November 28, 2023)
Percentage of teachers who were threatened with injury by a student during the previous 12 months, in the School year 2007-08 by urbanicity and instructional level [Graph], US Department of Education, & US Bureau of Justice Statistics, February 22, 2012. [Online]. Available: https://www.statista.com/statistics/183632/violence-against-teachers-by-students/