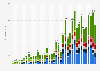
- Technology & Telecommunications›
- Telecommunications›
M2M (machine-to-machine) total industry size 2013-2022
Industry-specific and extensively researched technical data (partially from exclusive partnerships).
A paid subscription is required for full access.
M2M (machine-to-machine) total industry size 2013-2022
Size of the global machine-to-machine (M2M)* industry from 2013 to 2022 (in billion U.S. dollars)**

Machine-to-Machine industry size - additional information
Machine-to-machine (M2M) refers to technology that allows wireless and wired systems to communicate with other devices of the same type. Modern M2M communication has expanded far beyond a one-on-one connection and has developed into a system of networks that can transmit data to personal appliances. The value of connecting people from all over the world in one network has been recognized by many industries and M2M is now used in sectors such as agriculture, the military, government, and the health sector.
The service revenue generated by the global machine-to-machine market stood at 45 billion U.S. dollars in 2013 and is expected to rise to almost 200 billion within the next decade. Of the revenue forecast for 2018, some 8 billion will be generated in the healthcare segment and a further 7.1 billion U.S. dollars in the manufacturing industry.
Machine-to-machine connections on mobile phones allow the transmission of mobile data between devices on a cellular network. There were almost 195 million M2M connections worldwide in 2013, an increase from the 75 million in 2010. 42 percent of these connections in 2013 were located in Asia and a further 27 percent were in Europe. North America generated 18 percent of the connections, a decrease from the 25 percent it produced in 2010. Sweden was the country with the highest percentage of M2M connections in 2013 as over 23 percent of all of the country’s overall connections were machine-to-machine. In contrast, the figure in the United States stood at 9.2 percent of all connections and in the United Kingdom it was 7.8 percent.
Size of the global machine-to-machine (M2M)* industry from 2013 to 2022 (in billion U.S. dollars)**
Service revenue in billion U.S. dollars | |
---|---|
- | - |
- | - |
- | - |
- | - |
- | - |
- | - |
- | - |
- | - |
- | - |
- | - |
Service revenue in billion U.S. dollars | |
---|---|
- | - |
- | - |
- | - |
- | - |
- | - |
- | - |
- | - |
- | - |
- | - |
- | - |
You need a Premium Account for unlimited access.
Full access to 1m statistics
Incl. source references
Available to download in PNG, PDF, XLS format
You need a Premium Account for unlimited access.
Full access to 1m statistics
Incl. source references
Available to download in PNG, PDF, XLS format
© Statista 2019
About this statistic
Show source
Please be patient - this may take a moment
Description
Source
More information
Machine-to-Machine industry size - additional information
Machine-to-machine (M2M) refers to technology that allows wireless and wired systems to communicate with other devices of the same type. Modern M2M communication has expanded far beyond a one-on-one connection and has developed into a system of networks that can transmit data to personal appliances. The value of connecting people from all over the world in one network has been recognized by many industries and M2M is now used in sectors such as agriculture, the military, government, and the health sector.
The service revenue generated by the global machine-to-machine market stood at 45 billion U.S. dollars in 2013 and is expected to rise to almost 200 billion within the next decade. Of the revenue forecast for 2018, some 8 billion will be generated in the healthcare segment and a further 7.1 billion U.S. dollars in the manufacturing industry.
Machine-to-machine connections on mobile phones allow the transmission of mobile data between devices on a cellular network. There were almost 195 million M2M connections worldwide in 2013, an increase from the 75 million in 2010. 42 percent of these connections in 2013 were located in Asia and a further 27 percent were in Europe. North America generated 18 percent of the connections, a decrease from the 25 percent it produced in 2010. Sweden was the country with the highest percentage of M2M connections in 2013 as over 23 percent of all of the country’s overall connections were machine-to-machine. In contrast, the figure in the United States stood at 9.2 percent of all connections and in the United Kingdom it was 7.8 percent.
- Show sources information
- Show publisher information
- Release date
- January 2014
- Region
- Worldwide
- Survey time period
- 2013
- Supplementary notes
-
* The source defines M2M revenue as "All aggregated network, service and hardware revenues derived from cellular connected objects for the primary purposes of asset tracking, maintenance monitoring and related automated activities". it excludes associated aggregation devices and personal mobile broadband devices in the form of mobile handsets.
The vertical industries taken into account are Advanced Healthcare, Basic Healthcare, Home Security Smart Metering / Utilities, Consumer Electronics, Home Automation, Office Security, Office Metering / Utilities, Maintenance, Building Automation, Retail Outlets, Remote / Green Technology, Vehicles, Transportation and Other.
** Statista calculations based on figures provided by the source.
Source
- Show sources information
- Show publisher information
- Release date
- January 2014
More information
- Region
- Worldwide
- Survey time period
- 2013
- Supplementary notes
-
* The source defines M2M revenue as "All aggregated network, service and hardware revenues derived from cellular connected objects for the primary purposes of asset tracking, maintenance monitoring and related automated activities". it excludes associated aggregation devices and personal mobile broadband devices in the form of mobile handsets.
The vertical industries taken into account are Advanced Healthcare, Basic Healthcare, Home Security Smart Metering / Utilities, Consumer Electronics, Home Automation, Office Security, Office Metering / Utilities, Maintenance, Building Automation, Retail Outlets, Remote / Green Technology, Vehicles, Transportation and Other.
** Statista calculations based on figures provided by the source.
Other statistics on the topic
M2M (machine-to-machine) technologyYou only have access to basic statistics.
This statistic is not included in your account!
- Instant access to 1m statistics
- Download in XLS, PDF & PNG format
- Detailed references
$59 / Month *
Corporate solution including all features.
Prices do not include sales tax.


I think of Statista as Google for researchers. Statista provides you with the information you search for right away.Dr. Horst Stipp
EVP, Research & Innovation, Advertising Research Foundation
- Technology at airports
- Share of passengers using technology during air travel in 2017 and 2018, by major processing stepPassenger airlines: technology use by processing steps 2017-2018
- Share of airports worldwide expecting to trial new technologies in the next three years as of 2019, by typeGlobal airports: new technologies in the next five years by type 2019
- Share of airports with implemented or planned ID management solutions worldwide by 2021 and 2022, by major processing step ID management implementation at airports worldwide 2021-2022
- Percentage of airports with implemented and planned Business Intelligence (BI) initiatives in 2019 and 2022, by typeAdoption of Business Intelligence initiatives at airports 2019-2022
- Percentage of airports with AI use cases implemented or planned by 2022, by typeUse of AI at airports 2022
- Share of airline travelers worldwide who are interested in an inflight artificial intelligence assistant able to answer questions about the flight in 2019, by countryGlobal airline travelers - interest in inflight AI by country 2019
- Which emerging technologies and process advancements do you believe will improve efficiency and customer experience?Efficiency and customer experience improvement in airports 2019
- Booking and check-in
- Check-in method of airline passengers worldwide from 2015 to 2021Airlines: passenger check-in methods worldwide 2015-2021
- Share of passengers using self-service technology at airports in 2018, by major processing step and typeUse of self-service technologies at airports by processing phase 2018
- Passenger satisfaction rate during their journey in 2018, sorted by processing steps and type of passengerAirline passengers' satisfaction rate by processing steps and type of passenger
- Use of customer service at different processing steps in airports worldwide in 2019, by typeAirline passengers' use of customer service at processing steps in airports 2019
- Share of airline travelers worldwide who would prefer to speak to a person or use a self-service machine in 2019, by taskGlobal airline travelers - self-service vs in person by task 2019
- Bag drop and collection
- Average rate of mishandled bags by the global airline industry from 2011 to 2018 (per 1,000 passengers)Average rate of mishandled bags in the airline industry 2011-2018
- Reasons for delayed bags in world aviation industry in 2018Causes of delayed bags in air travel 2018
- Costs to the global airline industry due to mishandled bags from 2007 to 2018 (in billion U.S. dollars)Mishandled bags - cost to airline industry 2007-2018
- Share of airports that implemented self-service options from 2015 to 2022, by major processing step Airport adoption of self-service options by processing steps 2015-2022
- Security and dwell time
- Global security screening market size from 2018 to 2027 (in billion U.S. dollars)Market size of security screening worldwide 2018-2027
- What are the biggest opportunities for airports to streamline security?Best ways to make airport security more efficient worldwide 2019
- Share of airline travelers worldwide who are interested an inflight digital technology allowing self-completion of immigration and visa control in 2019, by countryGlobal airline travelers - interest in inflight digital immigration control 2019
- Share of airports worldwide offering mobile notification services from 2017 to 2021, by typeAirport adoption of mobile notification services by type 2017-2021
- Share of air passengers who want to receive proactive notifications in 2019, by notification typeAir passenger preferences for proactive notifications 2019
- Where do travelers spend most of their time while waiting for their flight? Passenger experience at airports worldwide 2019
- Which of the following would encourage you to spend more money in shops and restaurants at the airport?Incentives to spend money in shops and restaurants at airports 2019
- Inflight
- Share of air passengers satisfied with their journey in 2019, by regionAirline passengers' satisfaction by region 2019
- Share of airline passengers who prefer to use onboard WiFi in 2018, by servicePreferences of airline passengers for using onboard WiFi worldwide 2017
- Share of airline travelers worldwide who would like to be able to tailor the lighting within their inflight seating area in 2019, by countryGlobal airline travelers - opinion about customizable seat lighting on airplanes 2019
- Share of airline travelers worldwide who are interested in inflight virtual reality in 2019, by countryGlobal airline travelers - interest in inflight virtual reality by country 2019
- Share of airline travelers worldwide who are interested in airplanes whose interior featured digital screens on all surfaces in 2019, by countryGlobal airline travelers - interest in digital screens interiors on airplanes 2019
- Share of airline travelers worldwide who would like airplanes to have communal spaces for socializing in 2019, by countryGlobal airline travelers - opinion about communal space on airplanes by country 2019
- M2M connections worldwide as a percentage of total connections 2013, by country
- M2M total market revenue worldwide 2013-2017
- M2M total modules market volume worldwide 2013-2017
- M2M (machine-to-machine) connections worldwide 2010-2013, by region
- M2M connections worldwide as a percentage of total connections 2013
- Cellular M2M connections worldwide by country 2014 and 2020
- M2M (machine-to-machine) total number of connections worldwide 2010-2013
- Cellular M2M devices shipments within global retail industry 2013-2018
- M2M market size in Japan 2015-2021
- Share of M2M lines in Japan 2016, by purpose
- Mobile/cellular M2M connections in the US 2014-2020
- Accumulated number of M2M lines in Japan 2016, by purpose
- T-Mobile US M2M customers 2010-2014, by quarter
- France: machine to machine subscriptions 2008-2010
- Passenger airlines: technology use by processing steps 2017-2018
- Global airports: new technologies in the next five years by type 2019
- ID management implementation at airports worldwide 2021-2022
- Adoption of Business Intelligence initiatives at airports 2019-2022
- Use of AI at airports 2022
- Global airline travelers - interest in inflight AI by country 2019
- Efficiency and customer experience improvement in airports 2019
- Airlines: passenger check-in methods worldwide 2015-2021
- Use of self-service technologies at airports by processing phase 2018
- Airline passengers' satisfaction rate by processing steps and type of passenger
- Airline passengers' use of customer service at processing steps in airports 2019
- Global airline travelers - self-service vs in person by task 2019
- Market size of security screening worldwide 2018-2027
- Best ways to make airport security more efficient worldwide 2019
- Global airline travelers - interest in inflight digital immigration control 2019
- Airport adoption of mobile notification services by type 2017-2021
- Air passenger preferences for proactive notifications 2019
- Passenger experience at airports worldwide 2019
- Incentives to spend money in shops and restaurants at airports 2019
- Airline passengers' satisfaction by region 2019
- Preferences of airline passengers for using onboard WiFi worldwide 2017
- Global airline travelers - opinion about customizable seat lighting on airplanes 2019
- Global airline travelers - interest in inflight virtual reality by country 2019
- Global airline travelers - interest in digital screens interiors on airplanes 2019
- Global airline travelers - opinion about communal space on airplanes by country 2019
- M2M connections worldwide as a percentage of total connections 2013, by country
- M2M total market revenue worldwide 2013-2017
- M2M total modules market volume worldwide 2013-2017
- M2M (machine-to-machine) connections worldwide 2010-2013, by region
- M2M connections worldwide as a percentage of total connections 2013
- Cellular M2M connections worldwide by country 2014 and 2020
- M2M (machine-to-machine) total number of connections worldwide 2010-2013
- Cellular M2M devices shipments within global retail industry 2013-2018
- M2M market size in Japan 2015-2021
- Share of M2M lines in Japan 2016, by purpose
- Mobile/cellular M2M connections in the US 2014-2020
- Accumulated number of M2M lines in Japan 2016, by purpose
- T-Mobile US M2M customers 2010-2014, by quarter
- France: machine to machine subscriptions 2008-2010
Statista offers dossiers and reports on over 170 industries. With Statista you are always able to make informed decisions and boost your work efficiency.
- Social Media
- E-Commerce
- Online Video & Entertainment
- Advertising & Marketing
- Alcoholic Beverages
- Cleaning Products
- Cosmetics & Personal Care
- Food & Nutrition
- Health & Hygiene
- International Trade
- Shopping Behavior
- Sports & Leisure
- Business Travel
- Leisure Travel
- Accomodation
- Restaurants
- Demographics
- Economy
- Education & Science
- Politics & Government
- Aviation
- Rail Transport
- Vehicles & Road Traffic
- Water Transport
You can only download this statistic as a Premium user.
As a Premium user you get access to the detailed source references and background information about this statistic.
As a Premium user you get access to background information and details about the release of this statistic.
As soon as this statistic is updated, you will immediately be notified via e-mail.
...and make my research life easier.
You need at least a Premium Account to use this feature.
This feature is limited to our corporate solutions.
Please contact us to get started with full access to dossiers, forecasts, studies and international data.
We use cookies to personalize contents and ads, offer social media features, and analyze access to our website. In your browser settings you can configure or disable this, respectively, and can delete any already placed cookies. For details, please see your browser’s Help section (by pressing F1). Please see our privacy statement for details about how we use data.