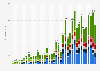
This statistic shows retail Internet of Things (IoT) spending in Middle East and Africa by country from 2013 to 2018. In 2014, IoT spending in the retail sector in Turkey amounted to 40.5 million U.S. dollars.
Retail IoT spending in Middle East and Africa by country from 2013 to 2018 (in million U.S. dollars)
Basic Account
Get to know the platform
You only have access to basic statistics.
This statistic is not included in your account.
Starter Account
The ideal entry-level account for individual users
- Instant access to 1m statistics
- Download in XLS, PDF & PNG format
- Detailed references
$189 USD $149 USD / Month *
in the first 12 months
Professional Account
Full access
Business Solutions including all features.
* Prices do not include sales tax.
Other statistics that may interest you Statistics on
About the industry
10
- Premium Statistic Saudi Arabia retail IoT spending 2013-2018
- Premium Statistic United Arab Emirates retail IoT spending 2013-2018
- Premium Statistic Internet of Things endpoint spending worldwide by category 2014-2020
- Premium Statistic EBITDA of Via Varejo in Brazil 2017-2022
- Premium Statistic Via net revenue in Brazil 2016-2022
- Premium Statistic EBITDA margin of Via in Brazil 2017-2022
- Premium Statistic Purchasing electronics and household appliances in physical stores Poland 2022
- Premium Statistic Customer Experience Index electronics and household appliance Poland 2022, by channel
- Premium Statistic Revenue of Xiaomi's IoT and lifestyle products 2017-2022
- Premium Statistic Global smart doorbell/digital door lock market 2020-2028
About the region
10
- Basic Statistic Total consumer and business expenditure in Africa 2015-2030
- Premium Statistic E-commerce revenue per online shopper in Africa 2017-2027
- Basic Statistic Ratio of military expenditure to gross domestic product (GDP) in Cabo Verde 2021
- Basic Statistic Ratio of military expenditure to gross domestic product (GDP) in Lesotho 2021
- Basic Statistic Ratio of military expenditure to gross domestic product (GDP) in Seychelles 2021
- Basic Statistic Ratio of government expenditure to gross domestic product (GDP) in Botswana 2028
- Basic Statistic Ratio of government expenditure to gross domestic product (GDP) in Namibia 2028
- Basic Statistic Ratio of government expenditure to gross domestic product (GDP) in Cabo Verde 2028
- Basic Statistic Ratio of government expenditure to gross domestic product (GDP) in Eritrea 2028
- Basic Statistic Ratio of government expenditure to gross domestic product (GDP) in Comoros 2028
Selected statistics
1
Other regions
10
- Premium Statistic Number of non-food retailers in the Netherlands 2017-2022
- Premium Statistic Smart city initiatives spending distribution worldwide 2020, by region
- Premium Statistic Household consumption expenditure on groceries in Norway 2018, by county
- Premium Statistic Value of food and non-food households spending in Italy 2016-2018
- Basic Statistic Share of retail spend in Germany 2013-2018, by channel
- Premium Statistic Ways to shop during the COVID-19 pandemic in Poland 2020
- Premium Statistic Retail trade and wholesale as share of GDP in Kuwait 2012 to 2019
- Premium Statistic Chile: change in retail sales 2019, by subsector
- Basic Statistic Businesses who believe coronavirus has caused a recession in Australia 2020 by state
- Premium Statistic Colombia: largest food retailers 2019
Related statistics
10
- Premium Statistic Retail sales of electronics in UAE 2012-2015
- Premium Statistic Health expenditure as share of GDP in the GCC 2019, by country
- Premium Statistic Private expenditures on healthcare in the GCC 2011-2020
- Premium Statistic Expenditures on healthcare in the UAE 2011-2027
- Premium Statistic Expenditures on healthcare in Kuwait 2011-2027
- Premium Statistic Expenditures on healthcare in Qatar 2011-2027
- Premium Statistic Expenditures on healthcare in the GCC by country 2020
- Premium Statistic Expenditures on healthcare in the GCC 2011-2027
- Premium Statistic Expenditures on healthcare growth in the GCC by country 2016-2020
- Premium Statistic Share of expenditures on healthcare in the GCC by country 2017-2027
Further related statistics
10
- Footwear retail sales volume trend in Great Britain (UK) 2008-2022
- Tesco's sales worldwide 2016/2017-2022/2023, by region
- Employee compensation and benefits at Deutsche Bank 2006-2022
- Electrical appliances retail sales volume index in Great Britain (UK) 2013-2022
- Games, toys and sports equipment: Sales volume index in Great Britain (UK) 2011-2022
- Retail video market: consumer spending on physical video in France 2008-2021
- U.S. oil and gas industry capex 2010-2021
- U.S. milk sales growth: leading vendors of white milk 2023
- Number of Nike stores globally 2009-2023
- Ethical personal products: spending in the United Kingdom (UK) 2011-2021
Further Content: You might find this interesting as well
Statistics
- Footwear retail sales volume trend in Great Britain (UK) 2008-2022
- Tesco's sales worldwide 2016/2017-2022/2023, by region
- Employee compensation and benefits at Deutsche Bank 2006-2022
- Electrical appliances retail sales volume index in Great Britain (UK) 2013-2022
- Games, toys and sports equipment: Sales volume index in Great Britain (UK) 2011-2022
- Retail video market: consumer spending on physical video in France 2008-2021
- U.S. oil and gas industry capex 2010-2021
- U.S. milk sales growth: leading vendors of white milk 2023
- Number of Nike stores globally 2009-2023
- Ethical personal products: spending in the United Kingdom (UK) 2011-2021
IDC. (August 19, 2015). Retail IoT spending in Middle East and Africa by country from 2013 to 2018 (in million U.S. dollars) [Graph]. In Statista. Retrieved September 30, 2023, from https://www.statista.com/statistics/486057/retail-iot-spending-in-middle-east-and-africa-by-country/
IDC. "Retail IoT spending in Middle East and Africa by country from 2013 to 2018 (in million U.S. dollars)." Chart. August 19, 2015. Statista. Accessed September 30, 2023. https://www.statista.com/statistics/486057/retail-iot-spending-in-middle-east-and-africa-by-country/
IDC. (2015). Retail IoT spending in Middle East and Africa by country from 2013 to 2018 (in million U.S. dollars). Statista. Statista Inc.. Accessed: September 30, 2023. https://www.statista.com/statistics/486057/retail-iot-spending-in-middle-east-and-africa-by-country/
IDC. "Retail Iot Spending in Middle East and Africa by Country from 2013 to 2018 (in Million U.S. Dollars)." Statista, Statista Inc., 19 Aug 2015, https://www.statista.com/statistics/486057/retail-iot-spending-in-middle-east-and-africa-by-country/
IDC, Retail IoT spending in Middle East and Africa by country from 2013 to 2018 (in million U.S. dollars) Statista, https://www.statista.com/statistics/486057/retail-iot-spending-in-middle-east-and-africa-by-country/ (last visited September 30, 2023)
Retail IoT spending in Middle East and Africa by country from 2013 to 2018 (in million U.S. dollars) [Graph], IDC, August 19, 2015. [Online]. Available: https://www.statista.com/statistics/486057/retail-iot-spending-in-middle-east-and-africa-by-country/