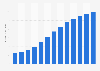
The statistic shows the total revenues of gaming and betting company Snaitech S.p.A. in Italy from 2011 to 2017. In 2011, the company's revenues amounted to 558.5 thousand euros. In 2016, this figure peaked at 898.4 thousand euros. In 2017, revenues slightly decreased to 889.6 thousand euros.
Total revenues of gaming and betting company Snaitech S.p.A. in Italy from 2011 to 2017 (in thousand euros)
Basic Account
Get to know the platform
You only have access to basic statistics.
This statistic is not included in your account.
Starter Account
The ideal entry-level account for individual users
- Instant access to 1m statistics
- Download in XLS, PDF & PNG format
- Detailed references
$59 USD $39 USD / Month *
in the first 12 months
Professional Account
Full access
Corporate solution including all features.
* Prices do not include sales tax.
Statistics on Gambling in Australia
Overview
6
- Premium Statistic Tourism contribution Australia FY 2021 by industry
- Premium Statistic Countries with the largest gambling losses per adult worldwide 2017
- Premium Statistic Total gambling expenditure Australia FY 2020, by type
- Premium Statistic Total gambling turnover Australia FY 2020, by state
- Premium Statistic Government revenue from gambling in Australia FY2010-2019
- Premium Statistic Casinos in Australia as of June 30, 2019, by state and territory
Consumption
4
- Premium Statistic Per capita gambling expenditure in Australia FY2010-2019
- Premium Statistic Per capita gambling expenditure Australia FY 2020, by type
- Premium Statistic Recent gambling participation in Australia 2018 by age
- Premium Statistic Per capita gambling expenditure Australia FY 2020, by state
Poker machines and gaming
5
- Premium Statistic Per capita gaming expenditure Australia FY 2020, by type
- Premium Statistic Per capita gaming expenditure Australia FY 2020, by state
- Premium Statistic Total gaming turnover Australia FY 2020, by type
- Premium Statistic Number of gaming machines operating in Australia 2011-2019
- Premium Statistic Number of venues with gaming machines in Australia as of June 30, 2019
Sports betting and horse racing
6
- Premium Statistic Gambling turnover from racing Australia FY 2019, by state
- Premium Statistic Sports betting turnover from racing Australia FY 2019, by state
- Premium Statistic Total racing expenditure Australia FY 2019, by type
- Premium Statistic Total sports betting expenditure Australia FY 2019, by type
- Premium Statistic Per capita gambling from racing expenditure Australia FY 2019, by state
- Premium Statistic Per capita sports betting expenditure Australia FY 2019, by state
Online gambling
6
- Premium Statistic Online gambling websites used in Australia 2019
- Premium Statistic Technology use in gambling Australia 2014-2018 by method
- Premium Statistic Share of bets placed by online gamblers in Australia 2019 by wagering type
- Premium Statistic Gender breakdown of online gambling Australia by wagering type 2019
- Premium Statistic Leading motivations for betting online Australia 2019
- Premium Statistic Share of gambling before and during COVID-19 in Australia 2020, by location
Industry leaders
6
- Premium Statistic Revenue distribution of Flutter Entertainment in 2021, by geography
- Basic Statistic Aristocrat revenue share fiscal 2015-2021, by segment
- Premium Statistic Operations NPAT of Tabcorp FY 2017-2021
- Premium Statistic EBITDA of The Star Entertainment Group FY 2018-2021
- Premium Statistic EBITDA of Crown Resorts FY 2018-2021
- Premium Statistic EBITDA of Australian Turf Club FY 2017-2021
Social impact and problem gambling
5
- Premium Statistic Leading self-control measures of online gamblers in Australia 2019
- Premium Statistic Gambling harm experienced as a result of betting online in Australia 2019
- Premium Statistic Monthly gambling expenditure before and during COVID-19 in Australia 2020, by gender
- Premium Statistic Gambling frequency before and during the coronavirus pandemic in Australia 2020
- Premium Statistic Effectiveness on the gamble responsibly slogan in Australia 2019
Further related statistics
8
- Italy: turnover of the Casinó Campione d'Italia 2011-2016
- Italy: net profits/losses of the Casinò di Campione 2012-2016
- Italy: employees of the Casinò di Campione 2012-2016
- Italy: cash inflow of the four casinos 2017
- Change in gaming expenditure Australia FY 2019 by type
- Total sports betting expenditure Australia FY 2019 by state
- Gambling expenditure of sports bettors Australia 2015 by gambling problem severity
- Total gaming expenditure Australia FY 2017 by state
Further Content: You might find this interesting as well
Statistics
- Italy: turnover of the Casinó Campione d'Italia 2011-2016
- Italy: net profits/losses of the Casinò di Campione 2012-2016
- Italy: employees of the Casinò di Campione 2012-2016
- Italy: cash inflow of the four casinos 2017
- Change in gaming expenditure Australia FY 2019 by type
- Total sports betting expenditure Australia FY 2019 by state
- Gambling expenditure of sports bettors Australia 2015 by gambling problem severity
- Total gaming expenditure Australia FY 2017 by state
SNAI Group. (May 1, 2018). Total revenues of gaming and betting company Snaitech S.p.A. in Italy from 2011 to 2017 (in thousand euros) [Graph]. In Statista. Retrieved January 30, 2023, from https://www.statista.com/statistics/685403/turnover-of-gaming-and-betting-company-snai-group-italy/
SNAI Group. "Total revenues of gaming and betting company Snaitech S.p.A. in Italy from 2011 to 2017 (in thousand euros)." Chart. May 1, 2018. Statista. Accessed January 30, 2023. https://www.statista.com/statistics/685403/turnover-of-gaming-and-betting-company-snai-group-italy/
SNAI Group. (2018). Total revenues of gaming and betting company Snaitech S.p.A. in Italy from 2011 to 2017 (in thousand euros). Statista. Statista Inc.. Accessed: January 30, 2023. https://www.statista.com/statistics/685403/turnover-of-gaming-and-betting-company-snai-group-italy/
SNAI Group. "Total Revenues of Gaming and Betting Company Snaitech S.P.A. in Italy from 2011 to 2017 (in Thousand Euros)." Statista, Statista Inc., 1 May 2018, https://www.statista.com/statistics/685403/turnover-of-gaming-and-betting-company-snai-group-italy/
SNAI Group, Total revenues of gaming and betting company Snaitech S.p.A. in Italy from 2011 to 2017 (in thousand euros) Statista, https://www.statista.com/statistics/685403/turnover-of-gaming-and-betting-company-snai-group-italy/ (last visited January 30, 2023)
Total revenues of gaming and betting company Snaitech S.p.A. in Italy from 2011 to 2017 (in thousand euros) [Graph], SNAI Group, May 1, 2018. [Online]. Available: https://www.statista.com/statistics/685403/turnover-of-gaming-and-betting-company-snai-group-italy/