
- Society›
- Demographics›
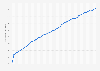
Number of households in Indonesia 2013-2021
Premium statistics
Industry-specific and extensively researched technical data (partially from exclusive partnerships).
A paid subscription is required for full access.
Number of households in Indonesia from 2013 to 2021 (in millions)
Exclusive Premium Statistic

Number of households in millions | |
---|---|
- | - |
- | - |
- | - |
- | - |
- | - |
Number of households in millions | |
---|---|
- | - |
- | - |
- | - |
- | - |
- | - |
Exclusive Premium statistic
You need a Premium Account for unlimited access.
Full access to 1.5m statistics
Incl. source references
Available to download in PNG, PDF, XLS format
Exclusive Premium statistic
You need a Premium Account for unlimited access.
Full access to 1.5m statistics
Incl. source references
Available to download in PNG, PDF, XLS format
About this statistic
Show source
Chart type
Datalabels
Share on Social Media
Please be patient - this may take a moment
- Show sources information
- Show publisher information
- Release date
- January 2017
- Region
- Asia, Indonesia
- Survey time period
- 2013 to 2016
- Supplementary notes
-
*Estimate.
**Forecast.
More information
- Region
- Asia, Indonesia
- Survey time period
- 2013 to 2016
- Supplementary notes
-
*Estimate.
**Forecast.
Other interesting statistics
Statista Accounts: Access All Statistics. Starting from $588 / Year
Basic Account
Get to know the platform
You only have access to basic statistics.
This statistic is not included in your account!
Premium Account
Your perfect start with Statista
- Instant access to 1m statistics
- Download in XLS, PDF & PNG format
- Detailed references
$49 / Month *
Corporate Account
Full access
Corporate solution including all features.
Prices do not include sales tax
(New York residents only).
Leading companies trust Statista:


I think of Statista as Google for researchers. Statista provides you with the information you search for right away.Dr. Horst Stipp
EVP, Research & Innovation, Advertising Research Foundation
Statistics on "Demographics of the U.S. Part II"
- Households and families
- Number of households in the United States in 2018, by type (in millions)Number of U.S. households 2018, by type
- Percentage of households in the U.S. from 1990 to 2017, by typePercentage of U.S. households 1990-2017, by type
- Number of households in the U.S. from 1960 to 2018 (in millions)Number of households in the U.S. 1960-2018
- Average number of people per household in the United States from 1960 to 2018Average size of households in the U.S. 1960-2018
- Number of households in the United States in 2017, by state (in millions)Number of U.S. households in 2017, by state
- Average size of households in the United States in 2017, by stateAverage size of U.S. households 2017, by state
- Number of households in the United States from 1970 to 2018, by size of household (in millions)Number of households in the U.S. by size of household 1970-2018
- Distribution of households in the United States from 1970 to 2018, by household sizeDistribution of households in the U.S., by household size 1970-2018
- Marriage and divorce
- Marital status of the U.S. population in 2018, by sex (in millions)Marital status of the U.S. population, by sex 2018
- Number of marriages in the United States from 1990 to 2017 (in millions)Number of marriages in the U.S. 1990-2017
- Number of divorces in the United States from 1981 to 2017 (in millions)Number of divorces in the U.S. 1981-2017
- Marriage rate in the United States from 1990 to 2017 (per 1,000 of population)USA - Marriage rate 1990-2017
- Divorce rate in the United States from 1990 to 2017 (per 1,000 of population)U.S. - divorce rate 1990-2017
- Marriage rates in the United States in 2017, by stateMarriage rates in the U.S. 2017, by state
- Divorce rate in the United States in 2017, by state (per 1,000 of population)U.S. - divorce rate by state 2017
- Number of married couples in the United States in 2018, by ethnic group and origin of spouses (in 1,000)Interracially married couples in the U.S. 2018, by race and Hispanic origin
Popular Related Keywords
Need help with using Statista for your research? Tutorials and first steps
Further Content: Statistics, Studies, and Topic Pages
Statistics
- Number of households in Bangladesh 2013-2021
- Number of households in Malaysia 2013-2021
- Number of households in the Philippines 2013-2021
- Number of households in Singapore 2013-2021
- Number of households in Sri Lanka 2013-2021
- Number of households in Thailand 2013-2021
- Number of households in Vietnam 2013-2021
- Number of households in Asia Pacific 2021, by country
- Number of households in China in 2011-2014
- Households of in Saudi Arabia 2017, by nationality
- United Kingdom (UK): Number of households by type and number of occupants in 2017
- Italy: households tax burden 2000-2016
- Average number of members per household in France 2012-2015
- Household composition Netherlands, by age of youngest child living at home 2016-2060
- Average size of slum households in India 2001-2011
- Average number of individuals per household in Sweden 2011-2017
- Average number of individuals per household in Norway 2007-2017
Studies
- Demographics of the U.S. Part II
- Families in Italy
- Demographics of the Dutch Caribbean
- Demographics of Japan
- Families in the U.S.
- Singles in the U.S.
- Demographics of the UK Part II
- Scottish Household Survey Annual Report 2014
- Demographics of the Netherlands
- Households and Families: 2010
- Poverty and Income in the United States
- Demographics of Italy
- Demographics of Scandinavia
- Millionaires in the United States
- Billionaires around the world
Statistics on the topic
Free statistics
- Number of households in the United States in 2018, by type (in millions)
- Percentage of households in the U.S. from 1990 to 2017, by type
- Number of households in the U.S. from 1960 to 2018 (in millions)
- Average number of people per household in the United States from 1960 to 2018
- Number of households in the United States in 2017, by state (in millions)
- Average size of households in the United States in 2017, by state
- Number of households in the United States from 1970 to 2018, by size of household (in millions)
- Distribution of households in the United States from 1970 to 2018, by household size
- Number of households in the United States by household income in 2017 (in millions)
- Number of households in the U.S. in 2018, by ethnic group (in millions)
- Number of families in the United States from 1960 to 2018 (in millions)
- Average number of people per family in the United States from 1960 to 2018
- Average size of families in the United States in 2017, by state
- Percentages of family households with own children under 18 years in the United States from 1970 to 2017, by type of family
- Number of families in the United States by number of children under 18 living in the household from 2000 to 2018 (in 1,000s)
- Percentage distribution of U.S. families, by household income level in 2017
- Number of families in the United States in 2017, by income level and race or origin (in thousands)
- Number of married couples in the United States from 1960 to 2018 (in millions)
- Percentage of husband-wife households with own children under 18 years in the U.S. in 2017, by state
- Number of families with a single father in the U.S. from 1990 to 2017 (in 1,000)
- Number of families with a single mother* in the U.S. from 1990 to 2017 (in 1,000)
- Percentage of households led by a single mother with children under age 18 living in the household in the U.S. in 2017, by state*
- Number of single-person households in the U.S. from 1960 to 2017 (in millions)
- Percentage of single-person households in the U.S. in 2017, by state
- Cities with the largest percentages of single-person households in the United States in 2017
- Marital status of the U.S. population in 2018, by sex (in millions)
- Marriage rate in the United States from 1990 to 2017 (per 1,000 of population)
- Divorce rate in the United States from 1990 to 2017 (per 1,000 of population)
- Marriage rates in the United States in 2017, by state
- Divorce rate in the United States in 2017, by state (per 1,000 of population)
- Number of married couples in the United States in 2018, by ethnic group and origin of spouses (in 1,000)
- Estimated median age of Americans at their first wedding in the United States from 1997 to 2017, by sex
- Estimated median age of Americans at their first wedding in the United States from 2016, by race and origin
- Number of households in the United Kingdom (UK) in 2017, by type and number of occupants (in 1,000)*
- Forecast of the household composition in the Netherlands from 2016 to 2060, by the age of the youngest child living at home (in thousand households)
Premium Statistics
- Number of marriages in the United States from 1990 to 2017 (in millions)
- Number of divorces in the United States from 1981 to 2017 (in millions)
- Number of households in Bangladesh from 2013 to 2021 (in millions)
- Number of households in Malaysia from 2013 to 2021 (in millions)
- Number of households in the Philippines from 2013 to 2021 (in millions)
- Number of households in Singapore from 2013 to 2021 (in millions)
- Number of households in Sri Lanka from 2013 to 2021 (in millions)
- Number of households in Thailand from 2013 to 2021 (in millions)
- Number of households in Vietnam from 2013 to 2021 (in millions)
- Number of households in the Asia Pacific region in 2021, by country (in millions)
- Number of households in China from 2011 to 2014
- Number of households in Saudi Arabia in 2017, by nationality ( in million)
- Amount of tax burden of households as consumers in Italy from 2000 to 2016 (in million euros)
- Average number of members per household in France from 2012 to 2015
- Average size of slum households in India in 2001 and 2011
- Average number of individuals per household in Sweden from 2011 to 2017
- Average number of individuals per household in Norway from 2007 to 2017
Statista Accounts: Access All Statistics. Starting from $588 / Year
Topics
About Statista
Statista offers dossiers and reports on over 170 industries. With Statista you are always able to make informed decisions and boost your work efficiency.
Internet & Telecommunications
- Social Media
- E-Commerce
- Online Video & Entertainment
- Advertising & Marketing
Consumer Goods & FMCG
- Alcoholic Beverages
- Cleaning Products
- Cosmetics & Personal Care
- Food & Nutrition
Retail & Trade
- Health & Hygiene
- International Trade
- Shopping Behavior
- Sports & Leisure
Travel, Tourism & Hospitality
- Business Travel
- Leisure Travel
- Accomodation
- Restaurants
Society
- Demographics
- Economy
- Education & Science
- Politics & Government
Transportation & Logistics
- Aviation
- Rail Transport
- Vehicles & Road Traffic
- Water Transport
Save statistic in .XLS format
You can only download this statistic as a Premium user.
Save statistic in .PNG format
You can only download this statistic as a Premium user.
Save statistic in .PDF format
You can only download this statistic as a Premium user.
Show source references
As a Premium user you get access to the detailed source references and background information about this statistic.
Show details about this statistic
As a Premium user you get access to background information and details about the release of this statistic.
Bookmark statistics
As soon as this statistic is updated, you will immediately be notified via e-mail.
Change statistics options
You need at least a Premium Account to use this feature.
Exclusive Corporate feature
This feature is limited to our corporate solutions.
Please contact us to get started with full access to dossiers, forecasts, studies and international data.
Corporate Account
Latest News

New Dossier: United States coal mining industry
U.S. coal production has steadily declined in the past decade, but has been in the news in recent years due to President Trump's desire to revitalize the industry. This document provides an overview of the key figures, leading companies, and the employment trends in the U.S. coal mining industry.

Global Consumer Survey offers PowerPoint export
This new export feature offers
- Structured graphical representation of the data
- Tailored target group analysis
- Option for further processing

New Dossier: E-commerce in Poland
The Polish e-commerce market is one of the fastest developing e-commerce markets in Europe. The latest data for Poland is presented in this dossier.

New Dossier: Plastic waste in the U.S.
Plastic waste is an issue of global concern. Since China banned the import of recycled plastic, the U.S. has had to make adjustments to its management of plastic waste. This dossier provides an overview of plastic waste in the U.S.

New Dossier: Hedge funds
This dossier provides an overview of hedge funds worldwide. Global hedge fund assets, performance, investors, and other topics are highlighted.

New exclusive OOH advertising data by OAAA
The Outdoor Advertising Association of America covers amongst others
- Number of billboards
- Outdoor advertising revenue
- Number of out-of-home displays

What happens after a no-deal Brexit?
Find data, perceptions & more about
- Economic consequences
- Impact on the labor market
- A second referendum

ecommerceDB.com: Ranking update – Spain
Understand the recent developments in the Spanish eCommerce market!
- URL-related revenues
- Relevant online store KPIs
- eCommerce-related contacts

Insights into the European banking sector
- Extended statistical dossier
- Insights, explanations & interpretations
- Challenges of the digital future

Dossier: Latin American online shopping events
eCommerce is rapidly becoming a part of the Latin American shopping culture. The dossier includes data on
- Regional online shopping events
- Events by country

Updated Brexit analysis in UK Industry Reports
The outline of potential impacts of Brexit on UK industries has been updated in the UK Industry Reports.

New Dossier: Digital Marketing in Italy
Italian enterprises invest significantly in digital marketing. Find out about
- Relevant aspects & KPIs
- New trends
- Different strategies

What is football all about, anyway?
Statista European Football Benchmark
- The big 5 European leagues
- All about the clubs & fans
- Sponsors & how they fit in

Payment methods in eCommerce
What are online shoppers' payment preferences around the world?
- Data on all payment methods
- Analysis for 50 countries
- Forecasts up to 2023

New Dossier: Foreign conflicts of Saudi Arabia
The kingdom of Saudi Arabia has faced political challenges.
- Perceptions & trade information
- Conflicts with Yemen, Iran, Qatar & Turkey
We use cookies to personalize contents and ads, offer social media features, and analyze access to our website. In your browser settings you can configure or disable this, respectively, and can delete any already placed cookies. For details, please see your browser’s Help section (by pressing F1). Please see our privacy statement for details about how we use data.